El Niño Southern Oscillation (ENSO).
Key concepts: Walker circulation. Indian Ocean Dipole. Why monsoons fail.
The El Niño/La Niña oscillation, also known as ENSO (El Niño Southern Oscillation), significantly influences local climatic conditions worldwide and is frequently mentioned in current climate change news. Let’s have a look under the hood.
For centuries, Peruvian fishermen noted that some years around Christmas time, the coastal sea water warmed noticeably, which is why they named the phenomenon El Niño, meaning “the Child” in Spanish (in fact “little boy”). In the 1980s, scientists discovered the opposite phase of El Niño and called it La Niña (in Spanish “little girl”).
Spain’s most popular lottery takes place every year on January 6th and is called “la loteria del Niño”.
In 1904, Gilbert Walker, a polymath, became the Director General of Meteorology at the India Meteorological Department. He aimed to understand the failed monsoons leading to the devastating 1899-1900 famine. Introducing correlation and regression, he developed models based on global precursors. Walker identified the Oscillation and predicted that El Niño conditions increase the likelihood of monsoon failure. His team developed the SOI (Southern Oscillation Index) statistical tools for El Niño predictions. However, the physical cause of the Southern Oscillation was discovered by J. Bjerknes in 1969, 11 years after Walker’s death.
Source: PAR / English Wikipedia. Released into the public domain by the author.
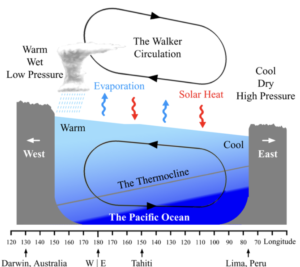
Trade winds push Pacific waters westward near the Equator, causing nutrient-rich cold water to rise along the Peruvian coast with help from the Humboldt Current. This supports abundant anchovy shoals and marine biodiversity. Pushed by the trade winds, the sea surface warms as it travels west toward Australasia, raising sea levels in the West and lowering the thermocline depth from West to East, aiding cold upwelling along the Peruvian coast. Consequently, at the Equator, the West Pacific is warmer and wetter than the East Pacific, creating low pressure in the West and high pressure in the East. Warm air rises in the equatorial West, loses moisture, cools down, and moves East to create a cool, dry high-pressure zone. This pressure difference also drives trade winds from East to West, forming the Walker circulation.

Source: NOAA Climate.gov, image by Fiona Martin. Public domain.
In neutral/La Niña years, the Walker circulation prevails. During El Niño conditions, trade winds weaken or even reverse, allowing warm water to move back toward the equatorial eastern Pacific, shifting cloudiness, rainfall and, crucially, low pressure to the equatorial East Pacific, and cooling and drying the equatorial West Pacific. The Walker Circulation is now reversed with high pressure in the East and low pressure in the West. Strong El Niño conditions heat up the Peruvian shore waters, significantly reduce upwelling and decimate the anchovy catch there. The pattern shifts intermittently every two to seven years, affecting ocean temperature and altering wind and rainfall patterns in the tropics. These changes in the seasonal climate of the world’s largest ocean lead to global climatic effects.
Source: NOAA Climate.gov image by Fiona Martin.
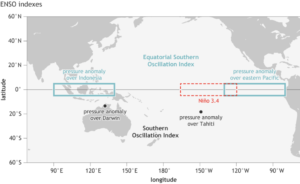
The Southern Oscillation Index (SOI), the oldest indicator of ENSO, measures the atmospheric pressure difference between Tahiti and Darwin. This pressure difference seesaw reflects the atmospheric component of ENSO, first noted in the early 1900s by Walker. During La Niña, pressure increases in Tahiti and drops in Darwin, making the SOI positive. During El Niño the opposite occurs, and the SOI is negative. While the SOI can be affected by short-term fluctuations, averaging it over months or seasons helps isolate longer-term deviations related to ENSO.
Source: Wikimedia Commons; Data Source:ftp://ftp.bom.gov.au/anon/home/ncc/www/sco/soi/soiplaintext.html
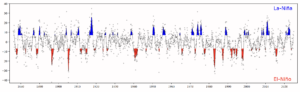
The ENSO is irregular, with many years of “neutrality” and sometimes repeating years of either El Niño or La Niña conditions (y-axis: SOI).
ource.: https://www.climate.gov/media/5541
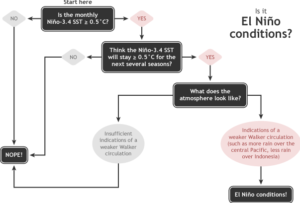
Source: Summary of NOAA decision process in determining El Niño conditions. NOAA Climate.gov drawing by Glen Becker and Fiona Martin. Public domain.
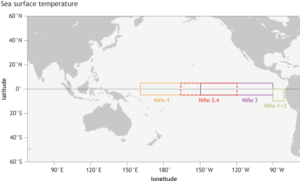
Nowadays, sea surface temperatures (SST) in the more equatorial Niño 3.4 area are combined with atmospheric condition observations to determine if El Niño or La Niña conditions are developing.
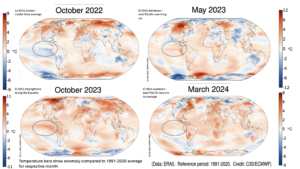
Source: Composed by RAF from four months of Copernicus C3S/ECMWF monthly bulletins. Data: ERA5 reanalysis, reference period 1991-2020. https://climate.copernicus.eu/surface-air-temperature-october-2023
Global warming is currently increasing at a rapid pace. In this context, El Niño conditions are concerning. In the absence of the cooling effect from cold deep ocean upwelling along the Peruvian coast, which spreads across the equatorial Pacific, these conditions can temporarily intensify global heat stress, leading to significant cascading climatic impacts worldwide.
What about Walker’s attempt of predicting failing monsoons by predicting El Niño conditions? Meet the ENSO’s neighbour, the Indian Ocean dipole.
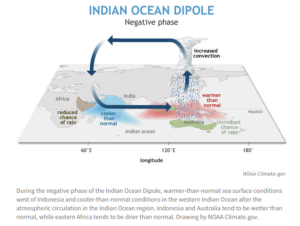
Source: NOAA Climate.gov. Public domain.
During a negative phase of the Indian Dipole, a strong high-pressure zone builds up over Madagascar and a low-pressure zone over the Indonesian archipelago. In parallel, during the Indian summer months, the Subtropical Western Jet Stream moves North from the Indian subcontinent to the Himalayas, creating a low-pressure zone over the Indian subcontinent. This low-pressure zone can then suck in the moist air from the Madagascar High, creating plentiful monsoons.

Source: NOAA Climate.gov. Public domain.
During a positive phase of the Indian Dipole, the Madagascar High moves to the Indonesian archipelago. The summer Low over the Indian Subcontinent cannot attract moist from the Indian Ocean in enough quantities to save the Monsoon.
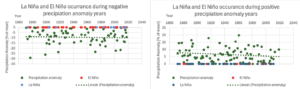
Source: Refreeze the Arctic Foundation, own analysis.
In the above graphs, the left graph plots El Niño years from about 1870 to 2020 (x-axis) against drought (decrease in precipitations, y-axis). Failed monsoons occur mostly during El Niño years with the trend on a slight increase. The right graph plots La Niña years from about 1870 to 2020 (x-axis) against rainfall (increase in precipitations, y-axis). Plentiful monsoons occur mostly during La Niña years, with the trend on a slight decrease. Both trends move in the wrong direction.
Neutral or La Niña conditions, thanks to rising warm air over the equatorial West Pacific, reinforce the Madagascar High during the negative Dipole phase and mitigate its demise during the positive Dipole phase. This High is key to a successful monsoon. Conversely, El Niño conditions, due to descending air over the equatorial West Pacific, weaken the Madagascar High in both situations, leading to poor or failed monsoons.
Make a donation
invest in the planet's future
RAF’s mission is to prove that MCB can brigthen marine clouds enough to cool the planet and thereby refreeze the Arctic. We have no time to waste. Donate today.