13. Economic cost of global warming.
Key concepts: 11 propositions to debunk erroneous economic assumptions. The Climate Repair Deal makes us all much, much better off.
The climate change debate is often reduced to a narrow economic cost-benefit analysis, disregarding the rights of future generations to a liveable planet. Fossil fuel and factory farming lobbies downplay or deny climate change, despite overwhelming peer-reviewed, fact-based scientific evidence.
However, even from a narrow economic cost-benefit view, the case for a Climate Repair Deal—centred on the 3 Rs: Reducing GHG emissions, Removing GHGs, and Refreezing the Arctic—is compelling. Dismantling the fossil fuel and factory farming industries benefits everyone, except a handful of fossil fuel company executives and shareholders. The economic advantages of moving beyond these industries far outweigh the costs of maintaining them, even without considering the rights of future generations (= our children and grandchildren!).
This must surely be the overwhelming argument in favour of the Climate Repair Deal: it makes us all much, much better off.
The RAF presents 11 key propositions that thoroughly debunk the erroneous economic arguments used by fossil fuel and factory farming lobbyists to justify their activities.
Proposition 1: The polluter must pay. Scope 3.
Proposition 2: Carbon Tax. Externalities.
Proposition 3: Popular support.
Proposition 4: The calamitous cost of inaction: usd 19-59 trillion per year by 2050. Carbon Capture and Storage (CCS) is extraordinarily expensive.
Proposition 5: Loss of life and biodiversity. 6th mass extinction, Habitat destruction, Invasive species, Pollution, human over-Population and Over-harvesting (HIPPO: includes Land Conversion, Tropical Deforestation, Biofuels Expansion, Forest Fires, Rivers in the Sky, Factory Farming, Coral Bleaching, Plastics, Emissions Inequality, Groundwater Depletion. Factory Fishing. Planetary Boundaries. Planetary Health check.)
Proposition 6: Fossil fuel industries’ strategic shift. An environmental catastrophe called coal. CO2 emissions: annual, per capita, by fuel type. Historic cumulative CO2 emissions. LULUCF.
Proposition 7: Renewables have by far the lowest Levelized Cost of Energy (LCOE). Jevons Paradox. Rare Earths.
Proposition 8: Renewables and job creation. “Reconstructible” Energy. Jobs/GWh.
Proposition 9: Fossil fuel’s best kept dirty secret: 70% (!!!) inefficiency.
Proposition 10: Greenhouse gases sector emissions. Transition is easier done than said.
Proposition 11: Peak oil, gas and coal. Transitioning to renewables is 4 to 12 times cheaper than adapting to climate change. Our addiction to fossil fuels is killing us. The sooner we act, the cheaper.
Let’s get started.
Proposition 1: The polluter must pay. Scope 3.
This approach promotes fairness and social justice by holding polluting industries accountable for the full extent of their environmental impact. The fossil fuel industry should be responsible not only for its own emissions during exploration and production of fossil fuels, but also for the emissions generated by the fuels it sells (“scope 3” emissions). The same accountability should apply to other industries: factory farming should pay for its pollution and biodiversity loss, the fishing industry should pay for recovering fishing nets and ropes lost at sea and biodiversity loss, plastics producers should cover the costs of recycling, the fashion industry should fund the recycling of discarded clothes etc…
For definitions of scope 1, 2, and 3 emission, see: https://www.nationalgrid.com/stories/energy-explained/what-are-scope-1-2-3-carbon-emissions
Proposition 2: Carbon tax. Externalities.
Many renewable energy projects may seem less financially viable than fossil fuel alternatives, but this changes when a carbon tax is imposed on fossil fuels to account for their environmental damage. By “internalizing externalities”— factoring in the true cost of fossil fuels, including environmental damage — renewable projects become competitive (see also Proposition 1). Even modest internalization can bring massive environmental benefits, like switching from heavy fuel to cleaner distillates in shipping to help save the Arctic, if only the shipping industry would take responsibility (see Chapter 5, Soot). The same applies to goods made using fossil fuel energy such as most Chinese goods that are manufactured using coal as energy source (see Proposition 5). A carbon tax, which would take account of “scope 3” CO2 emissions on products like coal, gasoline, plastics, cement, steel, electricity etc… could force industries to internalize pollution costs and would encourage cleaner practices.
In fact, on January 1, 2026, the EU is set to implement the first, rather timid, carbon import tax, the Carbon Border Adjustment Mechanism (CBAM). This tax will initially cover six sectors: cement, iron & steel, aluminium, fertilizers, hydrogen, and electricity‚Äã: https://taxation-customs.ec.europa.eu/carbon-border-adjustment-mechanism_en).
Stop-press: On October 4th, 2024, the EU imposed a 45% tax on Chinese EV imports for five years to protect its auto industry from Chinese dumping. From a global warming perspective, the RAF argues that Chinese EV makers massively benefit from low energy costs provided by resurgent, subsidised Chinese coal mining. An expanding fleet of new Chinese coal-fired power plants, which flaunt paying for the pollution they cause, are causing unimaginable catastrophic planetary damage.
Proposition 3: Popular support
Ordinary people should not shoulder the financial burden of the energy transition, climate mitigation, or adaptation. These changes can be funded through targeted subsidies to encourage consumer participation and by taxing the fossil fuel industry and high fossil fuel-consuming companies and individuals. Politicians must finally recognize that without strong middle-class support, the energy transition is destined to fail.
Proposition 4: The calamitous cost of inaction: usd 19-59 trillion per year by 2050. Carbon Capture and Storage (CCS) is extraordinarily expensive.
In April 2024, the Potsdam Institute for Climate Impact Research estimated that climate damage cost could reach USD 19-59 trillion per year by 2050, excluding(!) loss of life and biodiversity, even if we would cut GHG emissions today. The “lower” estimate equals the total GDP of the EU in 2023 (!). This calamitous yearly recurring economic destruction underscores the need for a deep reduction in GHG emissions and a swift transition to renewable energy. The cost of such a one-time transition would cost a fraction of the yearly damage of global warming (see Proposition 10). Even Carbon Capture and Storage (CCS), touted by the fossil fuel industry as a panacea, is extraordinarily expensive. It would cost USD 1 trillion per year more than a pathway focused on renewable energy, energy efficiency, and electrification, amounting to an additional USD 30 trillion by 2050 (Oxford Smith School, December 2023). Think of it: from now on, we need to capture every single molecule of CO2 we emit into the atmosphere and bury it underground.
Proposition 5: Loss of life and biodiversity. 6th mass extinction, Habitat destruction, Invasive species, Pollution, human over-Population and Over-harvesting (HIPPO, including Land Conversion, Tropical Deforestation. Biofuels Expansion. Forest Fires. Factory Farming. Coral Bleaching. Plastics. Emissions Inequality. Groundwater Depletion. Factory Fishing. Planetary Boundaries. Planetary Health check.)
Some losses transcend economic valuation. How do you measure the loss of a loved one to hunger, disease, drowning, or heat stress? A lost life is irreplaceable. Similarly, how do you value the loss of biodiversity? In proposition 4, the Potsdam Institute for Climate Impact Research avoids putting price tags on these losses. The answer is that biodiversity, of which we are an integral part, is priceless.
Biodiversity supports essential life support mechanisms: clean air, clean water, healthy soils, diversity of species. Biodiversity is key to sustaining the strength and adaptability of ecosystems, enhancing their stability and resilience to challenges like climate change, disease outbreaks, and¬†invasive species. Biodiversity sustains the Earth’s ability to regenerate after cataclysmic events.

Source: Our World in Data; data: WWF and Zoological Society of London, Living Planet Report. CC BY 4.0. ourworldindata.org/biodiversity
Currently, the species extinction rate is estimated between 1,000 and 10,000 times higher than natural extinction rates—the rate of species extinctions that would occur if we humans were not around. While extinctions are a normal and expected part of the evolutionary process, the current rates of species population decline and species extinction are high enough to threaten important ecological functions that support human life on Earth, such as a stable climate, predictable regional precipitation patterns, and productive farmland and fisheries. Scientists fear that we are in the middle of the 6th mass extinction (the 5th occurred 65 million years ago and wiped out the dinosaurs). Source: https://www.worldwildlife.org/stories/what-is-the-sixth-mass-extinction-and-what-can-we-do-about-it
What is a mass extinction? A mass extinction is a relatively brief period in geological history during which a large proportion of Earth’s biodiversity—distinct species of bacteria, fungi, plants, mammals, birds, reptiles, amphibians, fish, and invertebrates—disappears. The scientific consensus defines such an event as the loss of roughly 75% of species within a timespan ranging from several thousand to about two million years. However, there is a catch: over the past 500 years, fewer than 0.1% of known species have gone extinct. In that context, even if humanity managed to save half of all species, the outcome would still be catastrophic—yet far short of the threshold for a true mass extinction. The real challenge, therefore, is not to speculate about a sixth mass extinction, but to prevent human-driven extinction rates from climbing even to 0.2% (Wiens, Saban, 2025: https://doi.org/10.1098/rspb.2025.1717).
Biodiversity Loss Through the HIPPO Framework
Edward O. Wilson summarized the principal drivers of biodiversity loss using the acronym HIPPO: Habitat destruction, Invasive species, Pollution, human Population growth, and Over-harvesting. Contemporary assessments confirm that these drivers operate interactively across land systems, climate regulation, hydrology, and biogeochemical cycles (Steffen et al., 2015; IPBES, 2019; IPCC, 2023).
H — Habitat Destruction
A habitat is the natural environment where a plant, animal, or other organism lives, grows, and finds the food, water, and shelter it needs to survive.
Habitat destruction is driven primarily by land conversion, climate change and other forms of pollution.
Land conversion and livestock production
Livestock production is a dominant land-use driver. Current global land allocation indicates:
~3.4 billion hectares used as grazing land (predominantly cattle)
~1.4 billion hectares cropland, out of which
~40% of cropland (~0.55 billion hectares) devoted to livestock feed rather than direct human consumption (Poore & Nemecek, 2018; FEFAC, 2020)
Thus, nearly 4 billion hectares (ha) — a substantial fraction of global ice-free land — are directly tied to animal agriculture. In comparison, human settlements and infrastructure occupy roughly 0.2 billion hectares. However, humanity’s total ecological demand — including food, fiber, carbon absorption, and built infrastructure — totals ~20–22 billion ha, far exceeding Earth’s ~12–12.2 billion ha of biologically productive land and water (Seto et al., 2012; UN-Habitat, 2020; Global Footprint Network, 2024).
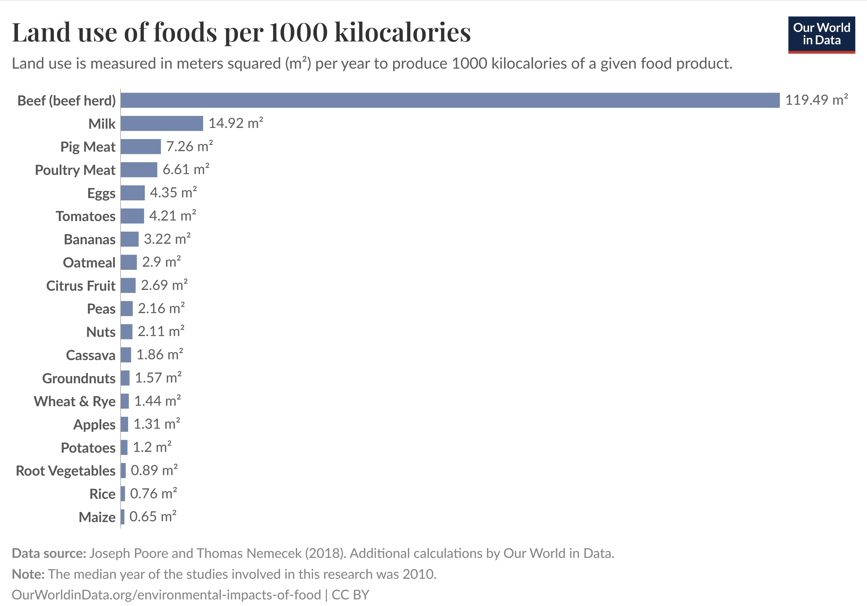
Source: Our World in Data; data: Poore & Nemecek (2018). CC BY 4.0. ourworldindata.org/environmental-impacts-of-food
The twentieth-century shift toward concentrated animal feeding operations (CAFOs) reduced meat prices and increased per-capita consumption (FAO, 2006; Tilman & Clark, 2014; Popkin, 2017). However, trophic energy losses inherent in feed-to-meat conversion result in substantially lower caloric and protein returns per hectare compared to plant-based systems (Smil, 2002; Poore & Nemecek, 2018). Beyond the profound moral wrong of animal cruelty, factory farming – another term used for CAFOs – is therefore a deeply inefficient system, given humanity’s outsized ecological land demand.
Tropical deforestation

Source: Hannah Ritchie / Our World in Data; data: INPE PRODES. CC BY 4.0. ourworldindata.org
The environmental impact of factory farming is profound. In the Amazon biome, approximately 80% of deforested land is used for cattle pasture (Barona et al., 2010; Curtis et al., 2018). The Amazon historically functioned as a net carbon sink. However, during 2015–2017 it shifted toward a net carbon source relative to a 2013 baseline, coinciding with drought, fire, and deforestation (IPCC, 2023). In 2022 it returned only narrowly to sink status, indicating declining resilience. Although deforestation of the Amazon is on the decline, it still progresses relentlessly at a time when we should be reforesting as breakneck speed to fight climate change by sequestering atmospheric CO2 in trees and soils, regulating hydrology (rivers in the sky, see below), recovering biodiversity (habitat expansion and improved connectivity), restoring soils (erosion reduction and rebuilding of organic soils), and enhancing regional cooling (evapotranspiration, cloud formation). In the above graph, 10,000 km2 = 1,000,000 ha; as reference, the size of Belgium is 30,600 km2, or 30,600,000 ha.
Biofuel expansion
Indonesia produces approximately 50 million metric tonnes of palm oil annually, up from 0.7 mio metric tonnes 50 years ago.

Source: Mongabay; chart by Hans Nicholas Jong; data: Auriga Nusantara. CC BY-ND 4.0. news.mongabay.com
Deforestation in the Indonesian archipelago — mainly for palm plantations (and pulpwood, and mining) — receives far less attention than the Amazon rainforest, yet its ecological impact is equally severe.
In defence of palm oil, palm plantations produce edible vegetable oils more efficiently than any other crop.
A palm oil plantation with 140–145 palms/ha produces 15–25 fresh fruit bunches (FFB) per tree, each weighing 15–25 kg. About 75 % of the FFB is mesocarp, yielding ~20 % crude palm oil (CPO), while 2.5 % is kernel, yielding ~50% palm kernel oil (PKO) and ~50% palm kernel meal (PKM), the latter a valuable factory farming feed. After removing the empty fruit bunches (EFB), accounting for water content and processing losses, annual yields are ~8,5 MT/ha CPO, ~1,00 MT/ha PKO, and ~1.00 MT/ha PKM. This oil yield greatly surpasses the optimal yields of conventional oilseed crops, such as sunflower or rapeseed (~0.8–1.2 MT/ha of crude vegetable oil), and even the best-performing super-high-density olive groves (~2 MT/ha of extra virgin olive oil).
However, Indonesia is increasingly diverting edible palm oil from food to fuel. Currently, approximately 25-30% of national palm oil output is used in biodiesel blends (Indonesian Ministry of Energy and Mineral Resources, 2023; USDA Foreign Agricultural Service, 2024). This proportion is expected to rise as the government implements progressively higher mandatory blending targets — B35, B40, and now B50 — where the number denotes the percentage of palm-based biodiesel mixed into conventional diesel. These mandates structurally lock in domestic demand, incentivize further plantation expansion, and intensify land-use pressure on tropical forest ecosystems.
The economics of palm oil biodiesel are weak. Crude petroleum trades at USD 50–100 per barrel (≈ USD 375–750 per metric ton), versus about USD 1,000 per metric ton for crude palm oil, making palm oil-based biodiesel structurally uncompetitive. The gap is filled by subsidies financed through export levies: Indonesia alone is expected to spend Rp 35–47 trillion (USD 2.1–3.1 billion) in 2025 to support B40, with costs rising further under B50. Environmental and land-use impacts – deforestation, biodiversity loss, and carbon emissions – are externalized (see Proposition 2, Externalities).
A similar dynamic applies to corn ethanol. In the United States, roughly one-third of the world’s largest corn crop (≈ 380 million MT vs ≈ EU 60 million MT) is diverted from food to produce ethanol, yielding an EROI of only ~1.0 – 1.5. The U.S. corn ethanol industry is therefore sustained by USD 10–15 billion annually in tax credits and blending mandates. Without such massive subsidies, neither palm oil biodiesel nor corn ethanol would exist.
By contrast, Brazil’s sugarcane ethanol delivers an EROI of ~8, making it economically and environmentally more sustainable.
These cases show how “food for fuel” distorts land use and markets.
Using ChatGPT, the RAF compiled a comparative table to assess renewable energy options. While indicative, the results suggest that many biofuels perform substantially less favourably – to use politically correct language – than solar photovoltaic (PV), which also has among the lowest levelized costs of energy production (see Proposition 7, Renewables have the lowest LCOE).
| System | Net energy (GJ/ha/yr) | Net usable energy after engine losses* (GJ/ha/yr) | EROI | Carbon intensity (gCO2e/MJ) | Deforestation-adjusted carbon intensity (gCO2e/MJ) | Land-use notes |
|---|---|---|---|---|---|---|
| Solar PV farm | 3,000–5,500 | 3,000–5,500 | 20–40 | 20–40 | 20–40 | Can use non-arable land |
| Oil palm biodiesel | 120–180 | 40–60 | 3–6 | 60–120 | >200–500 (if planted on recently deforested land) | High forest-pressure crop |
| Sugarcane ethanol (Brazil) | 90–130 | 30–45 | 6–9 | 15–35 | 50–120 (if rainforest or cerrado converted) | Best biofuel performer |
| Corn ethanol (U.S.) | 20–40 | 7–14 | 1–1.5 | 50–70 | 50–70 (low deforestation, mainly cropland) | High fertilizer & land input |
*Assumes ~33% average conversion efficiency for liquid fuels in internal combustion engines (see Proposition 9); 1 MWh=3.6 GJ; values shown represent indicative ranges derived from the literature: results depend on system boundaries, regional context, agricultural practices, and land-use change assumptions.
EROI is the ratio of energy produced to energy required to produce it.
At EROI ~1, “biofuel” crops are grown for the subsidies.
Carbon intensity is a measure of how much greenhouse gas is emitted per unit of energy produced or used. Carbon intensity typically includes: (i) upstream emissions (inputs, fuel production, processing) (ii) direct emissions during conversion or combustion (iii) sometimes land-use change emissions (critical for biofuels).
Forest fires
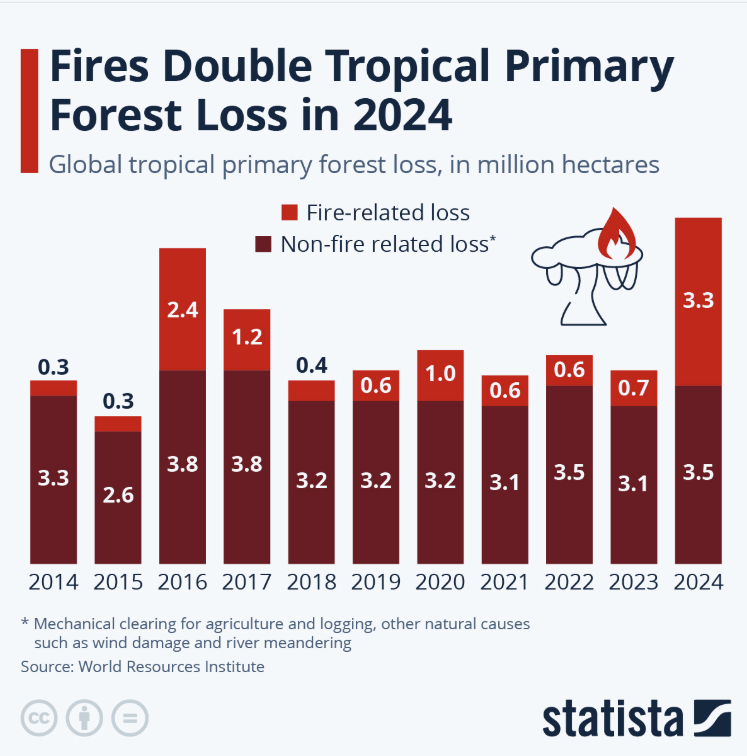
Source: Statista; data: World Resources Institute (WRI). CC BY-ND 4.0. statista.com
In fact, the condition of tropical primary forests is even more dire once the millions of hectares lost to forest fires are considered. The exceptionally hot and dry conditions of 2024 made it a particularly devastating year for Brazil (2.8 million ha lost), Bolivia (1.5 million ha lost, or 16%! of total land area), and Congo (WRI/GLAD, May 2025). Numbers vary wildly due to the lack of standardized definitions for tropical forests and wildfires, but the trend is clear. In theory, forests can regenerate after “natural” fires – but how “natural” were these events? To what extent did climate warming intensify them? And how long will regeneration take if illegal farming encroaches on the burned land?
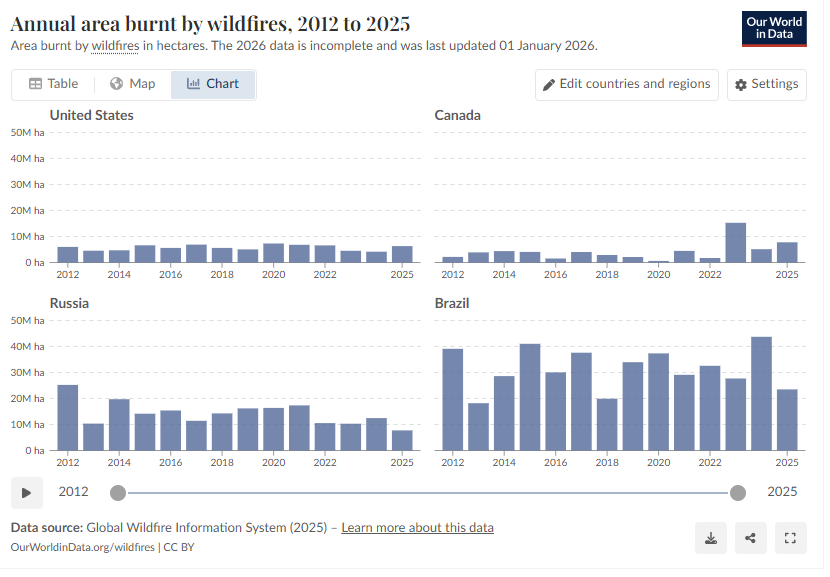
Source: Our World in Data; data: Global Wildfire Information System (GWIS) / Copernicus. CC BY 4.0. ourworldindata.org/wildfires
The annual area burned by wildfires in Brazil defies imagination: on average 30 mio ha (300.000 km2, abt 4% of total land area, or roughly ten times the size of Belgium). In a bad year, burned tropical primary forest area represents 10% of that total burned area.
In 2024, fires linked to tropical primary forest loss emitted an estimated ~3.1 Gt CO2e , according to satellite-based assessments (World Resources Institute/GLAD, 2025), comparable to India’s annual fossil fuel CO2 emissions (~2.7–3.0 Gt CO2; Global Carbon Project, 2024).
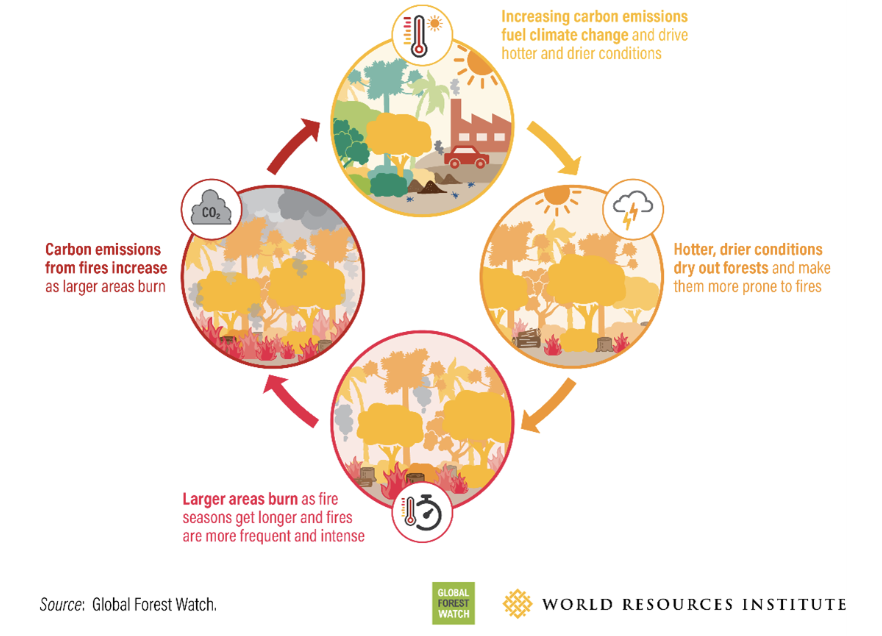
Source: Global Forest Watch / World Resources Institute (WRI). CC BY 4.0. wri.org
This underscores the climate significance of tropical forest fire dynamics: beyond their immediate emissions, forest fires intensify warming and drying, thereby reinforcing a powerful positive feedback loop that increases the likelihood and severity of future fires (see Chapter 6, Positive Feedback Loops and Chapter 7, Soot).
Rivers in the Sky
The Amazon biome generates the world’s largest “river in the sky” (atmospheric river: AR), delivering rainfall to itself and to otherwise arid regions to the south. Deforestation weakens this flow, reducing Brazil’s hydropower and threatening agriculture across southern Brazil, Paraguay, Uruguay, and Argentina, key global corn and wheat baskets.
https://www.youtube.com/watch?v=VGurBZ0b6nI&t=95s
| Region / AR | Approx. Moisture Transport | Primary Impact |
|---|---|---|
| Amazon Basin | 100–150 billion m3/day | Sustains Amazon rainfall; feeds southern Brazil, Paraguay, Uruguay, northern Argentina |
| Congo Basin | 50–70 billion m3/day | Supports Congo rainforest precipitation |
| Southeast Asia | 40–60 billion m3/day | Drives monsoon rains across Indonesia, Malaysia, Philippines |
| West Africa (Gulf of Guinea → Sahel) | 30–50 billion m3/day | Seasonal rainfall for the Sahel |
| North America (Pacific → West Coast / Rockies) | 20–40 billion m3/day | Heavy precipitation, hydropower, groundwater recharge |
Note: For context, the Amazon “river in the sky” transports roughly ten times the flow of the Mississippi River (~16 billion m3/day). Deforestation or land-use change in source regions can reduce these flows, decreasing rainfall far downstream.
Source: RAF ChatGPT search
The above table gives an overview of the ARs most relevant to agriculture. The majority of these regions are increasingly vulnerable to the impacts of global warming and widespread deforestation.
Bottom of Form
I — Invasive Species
Invasive species reduce native biodiversity through competitive displacement, trophic disruption, and habitat modification (IPBES, 2019). By competing for food, water, and habitat, they alter ecosystem structure and destabilize ecological balance.
By this definition, Homo sapiens is the most consequential invasive species at planetary scale: no other species has transformed as much land, appropriated as much net primary productivity, or altered biogeochemical cycles as extensively (Steffen et al., 2015). At the same time, globalization has accelerated the spread of other non-native species worldwide, many of which rank among the most damaging invasive organisms (IUCN; also check out https://en.wikipedia.org/wiki/100_of_the_World%27s_Worst_Invasive_Alien_Species).
Invasive species cause economic losses by damaging crops, forests, and fisheries. They pose health hazards, such as mosquitoes that transmit diseases like Nile virus, dengue fever, chikungunya, and Zika virus. They also damage infrastructure, like mussels clogging pipes and tree roots harming foundations, and degrade recreational areas such as parks and water bodies.
Human-driven habitat fragmentation, agricultural intensification, and climate change further facilitate invasions by creating disturbed ecosystems. Yet human societies depend on the stability of these ecosystems to provide pollination, soil fertility, freshwater regulation, carbon sequestration, disease buffering etc… Allowing ecosystems to collapse and reorganize over thousands of years would not be a wise plan for ensuring human survival.
P — Pollution
Anthropogenic pollution operates not only across atmospheric, terrestrial, and aquatic systems, it now also extends to our near-outer-space (check out the Kessler Syndrome in Chapter 12, Ozone Layer Depletion).
Discussing pollution beyond anthropogenic greenhouse gas emissions is outside the scope of this Deep Dive into Climate Change. The RAF refers to the work done by the Stokholm Resilience Centre and PIK (check out Planetary Boundaries in Over-Harvesting below).
Regarding atmospheric pollution, fossil fuel–related greenhouse gas (GHG) emissions remain the dominant driver of climate change and is the main subject of this Deep Dive. However, factory farming (industrial livestock production) is also a major contributor to global GHG emissions (IPCC, 2023), both indirectly through deforestation and feed production (see Habitat above) and directly via biological and soil processes.
Globally, livestock supply chains are estimated to emit approximately 7–8 gigatons (Gt) CO2-equivalent per year, or roughly 14–16% of total anthropogenic GHG emissions (FAO; IPCC, 2023). The principal components are:
Enteric methane (CH4): ~3.0 Gt CO2e/yr
Methane produced during ruminant digestion (primarily cattle). Methane has a 100-year global warming potential ~28–34 times that of CO2 (check out Chapter 3, GWP).
Manure management (CH4 and N2O): ~0.7–1.0 Gt CO2e/yr
Methane from anaerobic manure storage and nitrous oxide from manure decomposition.
Feed production and synthetic fertilizers (mainly N2O): ~1.3–1.6 Gt CO2e/yr
Nitrous oxide emissions from fertilized soils used to grow livestock feed. N2O has a 100-year warming potential ~265–298 times that of CO2.
Land-use change (CO2): ~2.0–2.5 Gt CO2e/yr
Carbon released from deforestation and soil disturbance associated with pasture expansion and feed-crop cultivation, particularly in tropical regions (excludes releases from primary forest wildfires, see Forest fires above).
Source: Graph made by RAF based on USDA, EPA, and GAO public data.
In the United States alone, factory farming produces approximately 426 million metric tons of manure annually, roughly twice the mass of human sewage. Unlike municipal wastewater, livestock waste is often untreated prior to environmental release, contributing to nitrogen and phosphorus runoff (eutrophication and hypoxic zones).
Together, these sources place livestock among the largest single sectoral contributors to anthropogenic greenhouse gas emissions, operating alongside and reinforcing fossil fuel–driven climate forcing (for a detailed analysis, check out proposition 10, Greenhouse gas emissions by sector, also regarding factory farming’s enormous demands on shipping).
Simply put: factory farming prioritizes cheap meat over ecological stability, public health, and long-term food security (FAO, 2006).
As discussed in Chapter 2, Greenhouse gasses absorb IR-radiation emitted by Earth, greenhouse gas emissions warm the atmosphere, and the oceans absorb over 90% of this excess heat, causing rising sea temperatures, marine heatwaves, coral bleaching, and circulation changes (IPCC, 2023). Simultaneously, about 25–30% of anthropogenic CO2 dissolves in seawater, forming carbonic acid, lowering pH by ~0.1 units (~30% more acidic), and reducing carbonate ions needed by corals, molluscs, and plankton.
Source: Dixon AM, Forster PM, Heron SF, Stoner AMK, Beger M (2022) Future loss of local-scale thermal refugia in coral reef ecosystems. PLOS Climate 1(2): e0000004. doi.org/10.1371/journal.pclm.0000004. CC BY 4.0.
This combination of higher seawater temperature and higher acidity will lead to the mass extinction of coral reefs by the time we reach 1.5°C above pre-industrial level: 84.1% of the coral reef refugia will have dwindled to 0.2%, whilst 6.8% of the exposed coral reefs will have increased to 90.6%. Beyond their breathtaking beauty, coral reefs serve as nurseries for nearly all marine life, except for jellyfish. Without coral reefs, our oceans are at risk of “jellifying”.
This is a climate catastrophe.
As hinted at in Chapter 9, Tipping Points, evidence indicates that low-latitude coral reefs are already crossing critical thermal thresholds. Repeated global bleaching events (1998, 2010, 2016–2017, 2023–2024) have caused mass mortality and reduced recovery capacity (Hughes et al., 2018; NOAA Coral Reef Watch, 2024). The IPCC projects 70–90% reef loss at 1.5°C and >99% at 2°C (IPCC, 2023). At ~1.2°C warming, many tropical reefs are already shifting from coral-dominated systems to algae-dominated states, indicating structural collapse. Are we “jellifying” our oceans?
Thus, GHG emissions both thermally stress marine ecosystems through warming and chemically stress them through acidification (for a more detailed quantification of the role of oceans, check out Chapter 4. A Quantification of Energy Fluxes).
The RAF is also dismayed by the accelerating plastic pollution crisis. Global plastic production is projected to rise from 464 million metric tons in 2024 to 884 million metric tons by 2050, nearly doubling despite an anticipated ~55% recycling rate for packaging. Such a trajectory will increasingly saturate ecosystems with macro-, micro-, and nano-plastics, posing escalating risks to biodiversity and human health (DOI: 10.1016/j.spc.2024.09.025). Such plastic pollution could easily be reined in by applying the principles of Propositions 1, The Polluter must Pay, 2, Carbon Tax and 3, Popular Support.
P — Population Growth
Source: Our World in Data; data: HYDE, UN World Population Prospects (2024). CC BY 4.0. ourworldindata.org
In less than a hundred years, the human species quadrupled from 2 billion in 1925 to 8 billion in 2023 (!) and might peak at 10.4 billion by 2086. But the growth will be uneven. China’s population will drop from 1.4 billion today to 865 million – or even 525 million – by 2100 (check out: https://www.vu.edu.au/about-vu/news-events/news/chinas-population-shrinks-again-and-is-set-to-more-than-halve ). On the other hand, India’s will rise from 1.4 billion to 1.5 billion. Africa’s population is set to grow from 1,5 billion today to 2,4 billion by 2050 and in some projections to 4,2 billion by 2100, trailing only Asia’s 4,8 billion.
The rapid expansion of Homo sapiens combined with the global spread of high-consumption lifestyles have placed extreme pressure on Earth’s ecosystems (Steffen et al., 2015; IPBES, 2019).
IEA (2023), Global energy-related CO2 emissions by decile, 2021, IEA, Paris. CC BY 4.0. iea.org
Unsurprisingly, the top 10% of income earners account for nearly half(!) of all CO2 emissions, while the top 30% are responsible for roughly 80%.

Source: Stockholm Environment Institute (SEI) Emissions Inequality Dashboard. CC BY. emissions-inequality.org
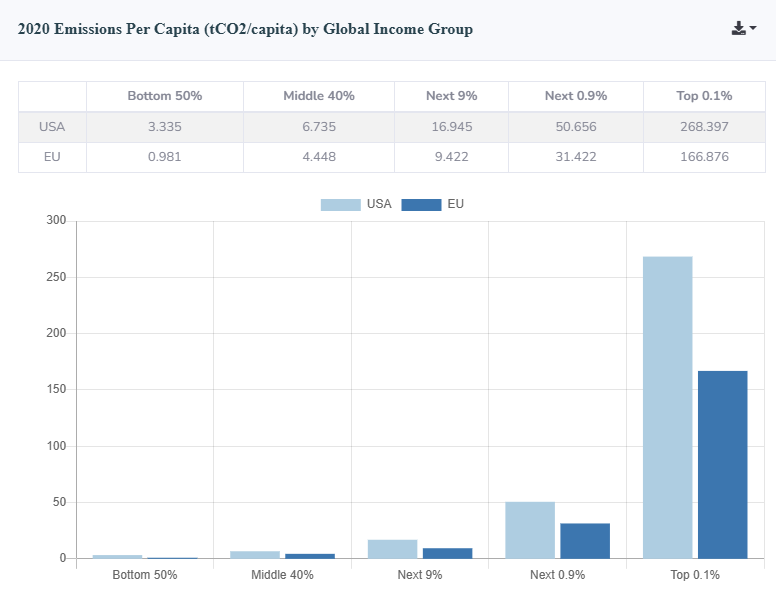
Source: Stockholm Environment Institute (SEI) Emissions Inequality Dashboard. CC BY. emissions-inequality.org
As shown in the above graphs, in industrialized countries, the top 1% of earners account for a disproportionately large share of CO2 emissions. As argued in Propositions 1, The Polluter must Pay 2, Carbon Tax and 3, Popular Support, this affluent segment of society is uniquely positioned to lead decarbonization efforts, yet it continues to fall short of assuming a commensurate share of responsibility.
This “emissions inequality” across society lies at the core of the global warming crisis. In Propositions 9, Fossil Fuel’s Best-Kept Dirty Secret, and 10, Greenhouse Gas Sector Emissions, the RAF contends that a rapid energy transition could reduce greenhouse gas emissions by nearly 50% simply by replacing the inefficient fossil fuel internal combustion engine with electric motors driven by renewable electricity. A sectoral analysis further shows that, in developed economies, substantial emissions cuts are achievable with relatively limited effort. Ironically, since 2015, electricity from solar and wind has become cheaper than even the cheapest fossil fuel, natural gas (CH4). Renewables offer a rare path to both greater prosperity and major emissions reductions – a clear win for all of society, leaving no one behind (Proposition 7, Renewables have the by far lowest LCOE).
As long as greenhouse gas emissions remain unregulated, the planet faces a global tragedy of the commons: affluent groups will continue to release emissions unchecked, treating the atmosphere as an open sewer.
O — Over-harvesting
Overharvesting refers to extraction rates that exceed natural regeneration capacity in renewable systems such as forests, fisheries, soils, and aquifers. It excludes mining, which involves the depletion of non-renewable resources without regeneration.
A full discussion of overharvesting beyond anthropogenic greenhouse gas emissions falls outside the scope of this Deep Dive into Climate Change. Readers are referred to the work of the Stockholm Resilience Centre and the Potsdam Institute for Climate Impact Research (see Planetary Boundaries below). However, building on the preceding analysis of factory farming’s damage to biodiversity, the RAF draws attention to a related but often overlooked, dramatic form of overharvesting: groundwater depletion.
Vast areas of fertile land are diverted to produce animal feed, grow biofuel crops, and support unsustainable grazing practices, rather than being used directly to nourish people. This inefficient use of land accelerates deforestation, including the destruction of primary forests, and places immense strain on ecosystems. At the same time, agriculture consumes about 70% of global freshwater withdrawals, intensifying pressure on rivers and aquifers and driving severe groundwater depletion in many of the world’s most important farming regions.
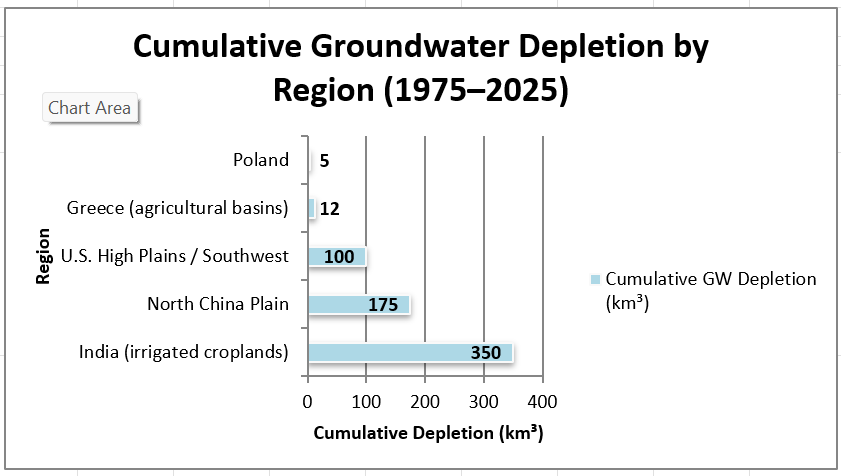
Source: RAF (own analysis based on public GRACE satellite data)
A quick RAF ChatGPT search shows substantial variation in groundwater (GW) extraction across agricultural regions, with North-East and South-East Europe included in the sample (the more recent data are based on Grace and Grace FO satellite measurements).
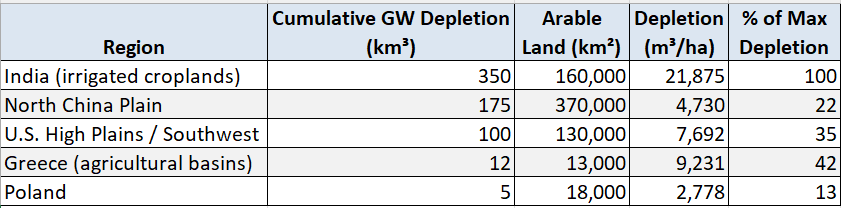
Source: RAF (own analysis).
Further analysis indicates that groundwater extraction in several major agricultural regions is likely exceeding natural recharge rates, placing long-term freshwater availability at serious risk. Persistent overdraft has already been documented in India and the U.S. High Plains, while Mediterranean regions are projected to face worsening water stress as climate change alters precipitation patterns and increases the frequency of droughts (e.g., IPCC, 2021; USGS, 2022; Rodell et al., 2018; EEA, 2022; World Bank, 2023).
The dramatic water crisis unfolding in Iran, Iraq, and Syria stems from a combination of climate change and chronic water mismanagement. Reduced rainfall and prolonged heatwaves have lowered river flows, while overpumping of groundwater, inefficient irrigation, poorly maintained infrastructure, and upstream dam controls (in neighbouring Turkey) have sharply reduced water availability. These factors together have triggered severe shortages for agriculture, cities, and ecosystems, highlighting how governance failures can amplify climate-induced water stress (e.g., UN Water, 2022; World Bank, 2023).
In conclusion, beyond large-scale deforestation, factory farming and most biofuel production – with the possible exception of sugarcane ethanol – pose systemic threats to planetary stability by generating multiple, interacting pressures that destabilize Earth systems (FAO, 2006; IPCC, 2023).
An in-depth discussion of over-harvesting of our oceans is also beyond the scope of this Deep Dive. Fortunately, many coastal nations are waking up to their responsibilities to protect “their” wild fish stocks. Simple, common-sense measures like banning the most destructive fishing methods, introducing quotas and creating “no-take marine protected areas” (no-take MPAs, also in marine wind turbine parks?) work miracles for wild fish stock recovery. It might however be a matter of too little, too late. Invasive “global capture” fisheries are plundering global fish stocks and are surprisingly polluting.
In the UK, a small number of industrial supertrawlers – around 26 foreignflagged vessels – operate in domestic waters, including MPAs, and export much of their catch abroad, while thousands of small-scale fishers make up the rest of the fleet, highlighting stark inequalities in quota allocation and access to fishing grounds (Geographical, 2023; Greenpeace UK, 2024). China’s distant-water fishing fleet on the other hand, is responsible for 44 % of visible global fishing, avoids Chinese MPAs but aggressively exploits high-seas and foreign waters, exposing a stark double standard between domestic protection and industrial-scale overseas fishing (Oceana, 2025).
Fishing vessels emit an estimated 0.04–0.18 Gt of CO2-equivalent annually, mainly from fuel combustion, accounting for about 0.5 % of total anthropogenic emissions and roughly 4 % of food-system emissions (OECD, Review of Fisheries, 2025).
In another tragedy of the commons, lost and abandoned fishing gear fuels a massive plastic crisis – it makes up about 10 % of all ocean plastics globally (IISD, 2023) and, by weight, dominates large floating debris with up to ~70 % in some ocean gyres (Smithsonian, 2023).
Is marine aquaculture an answer to marine fish stock depletion? Modern Atlantic salmon farming has sharply cut its reliance on wild fish: the “fish-in fish-out” ratio has fallen from roughly 3–5 kg of wild fish per kg of farmed salmon in the early 2000s to about 0.5–0.8 kg today, thanks to improved feed efficiency and a shift to plant proteins, oils, and other alternatives, with marine ingredients now accounting for just 20–30 % of feed (Naylor et al., 2009; 2021; FAO, 2022). However, fish farmers still rely on fish oil from forage fisheries, raising ongoing sustainability concerns (FAO, 2022). Given all the other issues associated with marine aquaculture, the answer is: perhaps not.
As argued in Proposition 10, even modest dietary shifts could sharply cut the impacts of factory farming and factory fishing, true “low-hanging fruits” for climate action – yet such high-impact measures remain scarcely adopted (Poore & Nemecek, 2018; Tilman & Clark, 2014). Equally, most biofuels depend on heavy subsidies, divert land from food or carbon sinks, and remain environmentally unsustainable, offering far less climate benefit than solar or wind energy.
With safe operating limits already breached in multiple domains, rethinking agriculture and fisheries for a warming world is not merely urgent, but imperative.
This reluctance to implement comparatively simple solutions has contributed to humanity’s transgression of several planetary boundaries, further destabilizing Earth’s life-support systems (Steffen et al., 2015; IPBES, 2019).
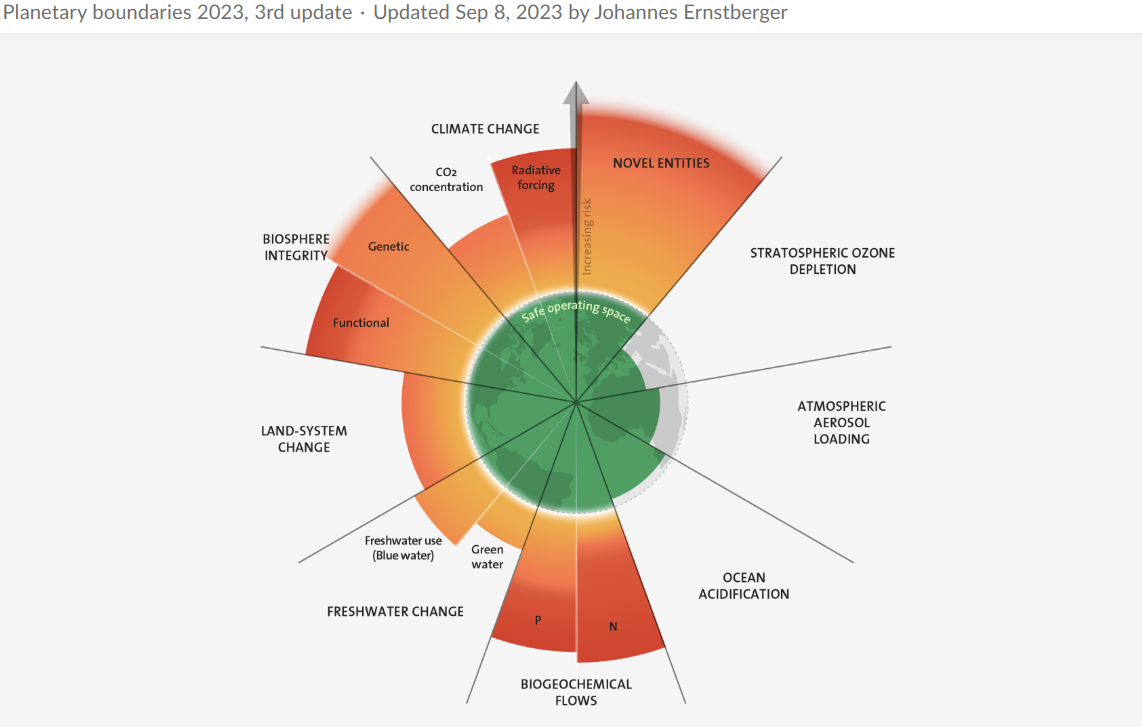
Source: Stockholm Resilience Centre; 2023 update by Johannes Ernstberger et al., based on Richardson et al. (2023). CC BY 4.0. stockholmresilience.org
In 2009, the Stockholm Resilience Centre identified the nine interdependent processes which regulate Earth’s stability and resilience. They called them the Nine Planetary Boundaries.
Due to Profligacy and Over-harvesting, compounded by anthropogenic global warming, humans have now exceeded the “Safe Operating Space” in six of the nine boundaries, with many of them now deeply in the red zone. A 7th, ocean acidification, will soon be exceeded. Only a systemic approach of all of them at once can bring Earth back into the “safe operating space”.
What is the novel entities planetary boundary? These novel entities include plastics, antibiotics, “forever chemicals” – also known as per- and polyfluoroalkyl substances (PFAS) – which do not break down in our ecosystems, nuclear waste, GMO material etc…
Based on the Nine Boundaries concept, The Potsdam Institute for Climate Impact Research (PIK) now publishes an unfortunately grim yearly planetary health check: https://www.planetaryhealthcheck.org/
Most planetary boundaries, however, are tightly interlinked. A rapid shift away from fossil fuels and factory farming and fishing would relieve pressure on seven of the nine boundaries, substantially stabilizing the Earth system. That pathway remains open — provided critical tipping points (see Chapter 9, Tipping Points) have not yet been crossed. But time is in short supply. Humanity may have no more than fifty years to confront the HIPPO drivers directly, even as global warming accelerates.
Crucially, Propositions 7 through 11 show that ending waste, fossil fuel addiction, most biofuels, industrial farming and fishing, and overharvesting – while safeguarding our habitats – is not a utopian dream but a practical, achievable path forward. The transition is not about sacrifices: it is technically feasible, economically sound, and socially manageable. Far from imposing hardship, it delivers global gains — greater resilience, better health, more and better jobs, better pay, long-term cost stability, and higher quality of life — while requiring only modest, within-reach changes to daily routines. The caveat is stark: if tipping points are crossed, the calculus changes completely.
Proposition 6: Fossil fuel industries’ strategic shift. An environmental catastrophe called coal. CO2 emissions: annual, per capita, by fuel type. Historic cumulative CO2 emissions. LULUCF.
In March 2024, under pressure from disgruntled shareholders who were envying ExxonMobil profits, Shell announced a strategic shift away from renewables to boost investment in oil and gas.
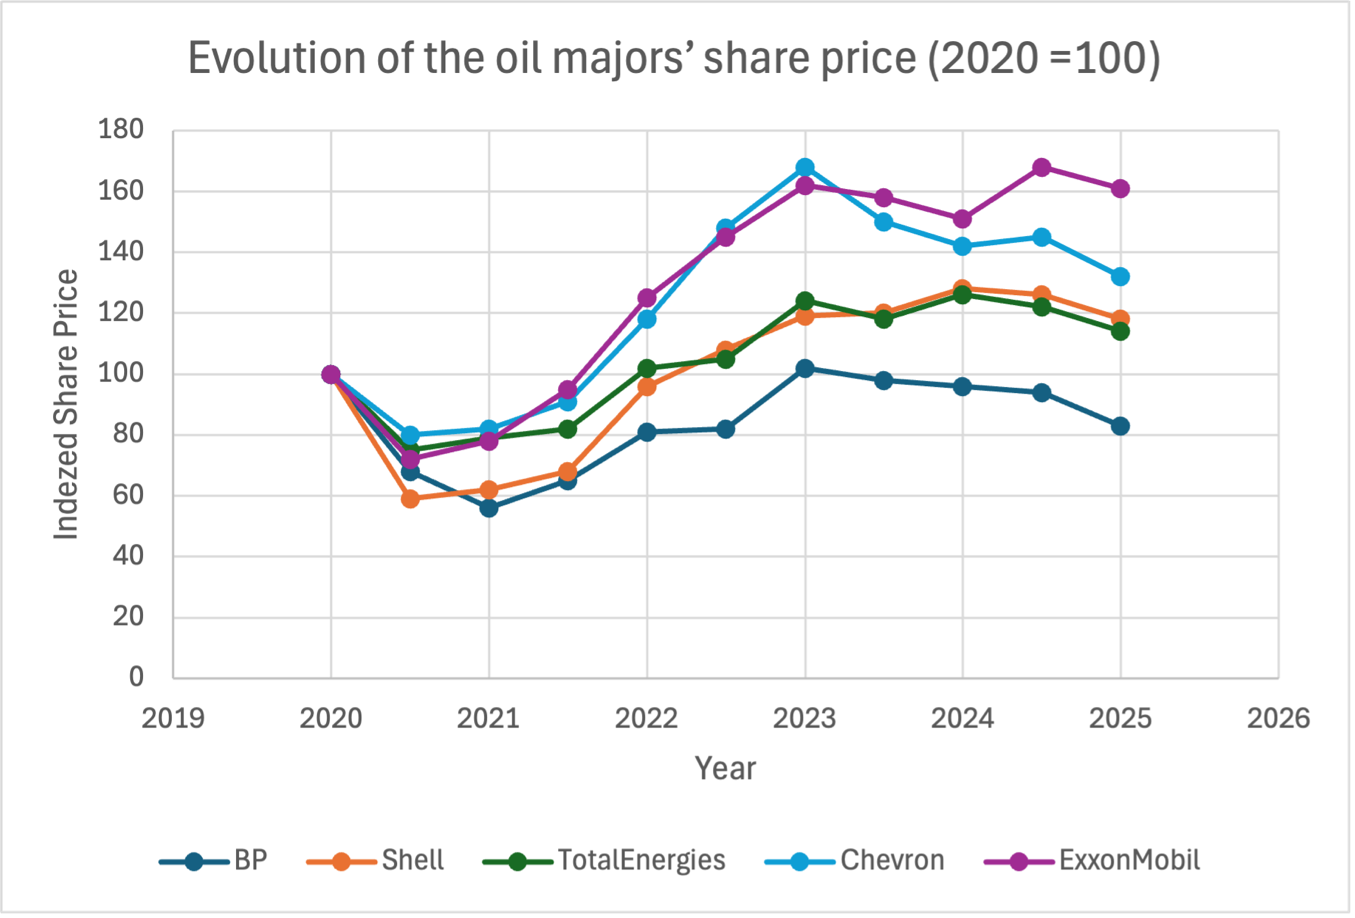
Source: RAF composed graph based on public share-price data (Yahoo Finance and other public market sources).
The above graph shows the evolution of the oil majors’ share price with 2020 as starting point
The trend is clear. In 2023, BP postponed emissions targets to focus on oil and gas, while TotalEnergies planned a 2-3% annual production increase for five years. ExxonMobil, the darling of the industry, has systematically being doubling down on E&P (exploration and production). To its credit, it researched the impact of fossil fuels on the climate, only to then hide the results for 30 years. U.S. shale-oil companies continue expanding fossil fuel operations. However, today, the state-owned giants dominate the field, producing 60%-70% of all oil and gas and barely suffer any criticism. Aramco, ADNOC, CNPC (China), the Iranians, the Iraqis, KPC (Kuwait), Rosneft and Gazprom, Petrobras, and Pemex are drilling more than ever. The same applies to Norway’s Equinor, rebranded from Statoil to obscure its past identity. Pemex is launching a $16.8 billion refinery at Dos Bocas, Tabasco province, and Venezuela’s Maduro (now in U.S. custody) is threatening to seize Guyana’s recently discovered offshore oil fields by force. The trend remains bleak and depressing.
None of these activities would make much sense if these fossil fuel companies had to pay for their scope 3 emissions (Proposition 1) and fossil fuels were taxed to reflect the environmental damage they cause (Proposition 2).
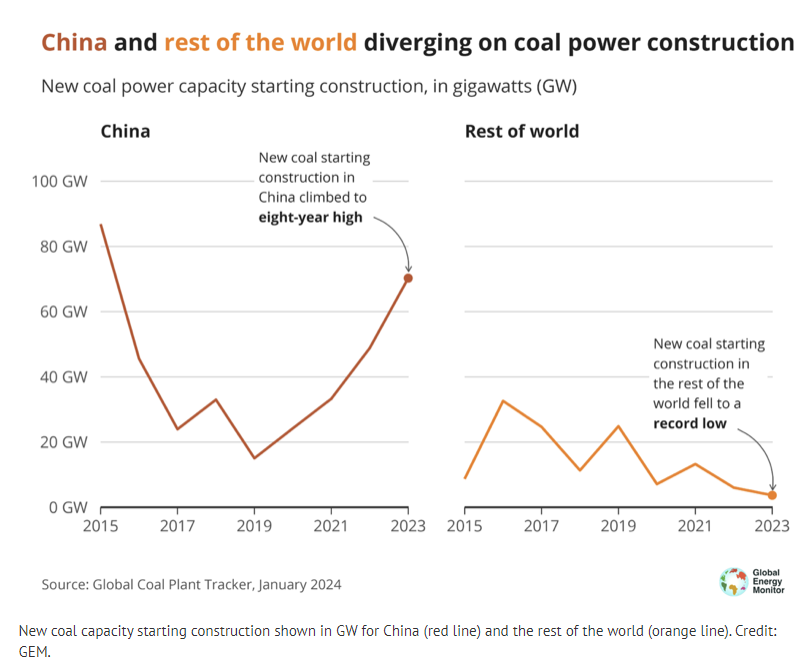
Source: Global Energy Monitor (GEM), Global Coal Plant Tracker, January 2025. CC BY 4.0. globalenergymonitor.org
Developments in China are deeply alarming. China has shocked the world by adding 256 GW of new coal-fired capacity since 2020 – including 78 GW in 2025 alone – with more plants underway. Its coal addiction is not confined to domestic borders: over the past decade, China has funded 54 GW of overseas coal-fired plants, with another 19 GW already in the pipeline, exporting its carbon footprint worldwide.
China may pledge carbon neutrality by 2060, but it shows little intention of cutting coal emissions anytime soon. Even as it builds vast renewable and nuclear power capacity, it continues expanding coal power to fuel industrial dominance and its transition to an “electrostate.” That choice locks in decades of avoidable emissions, effectively cooking the planet during the very years scientists say are critical.
India is rapidly expanding its coal-fired fleet – 30 GW since 2020 – in an effort to match China’s industrial growth.
Check out: https://globalenergymonitor.org/projects/global-coal-plant-tracker/
To put these numbers in perspective, the huge Hinckley Point C nuclear power plant, Europe’s largest building site, under construction in the UK, is rated at 3 GW. China is therefore building on average 14(!) coal-burning Hinckley Point Cs per year.
Unknown to most, China has even recently built–up a thriving coal–to–chemicals sector, mainly to produce liquid fuels (mainly diesel and gasoline) via the Fischer-Tropsch process.
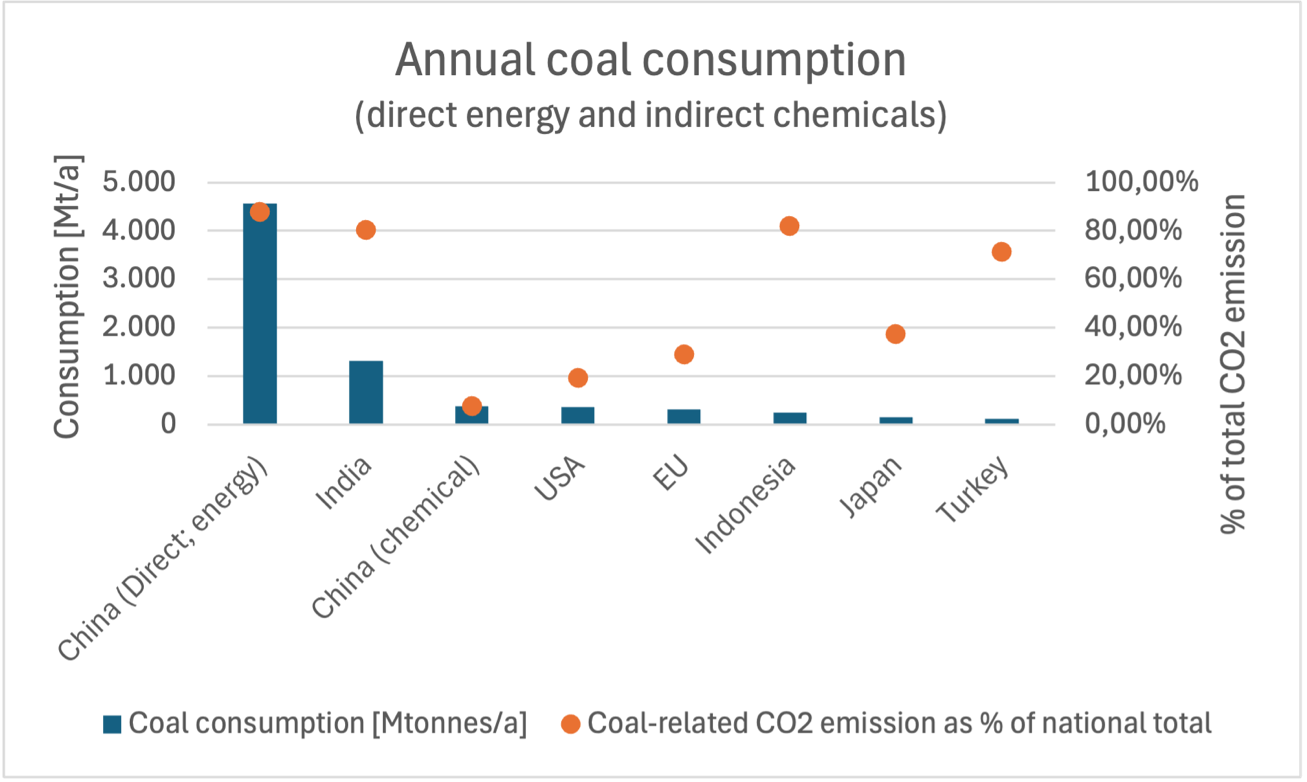
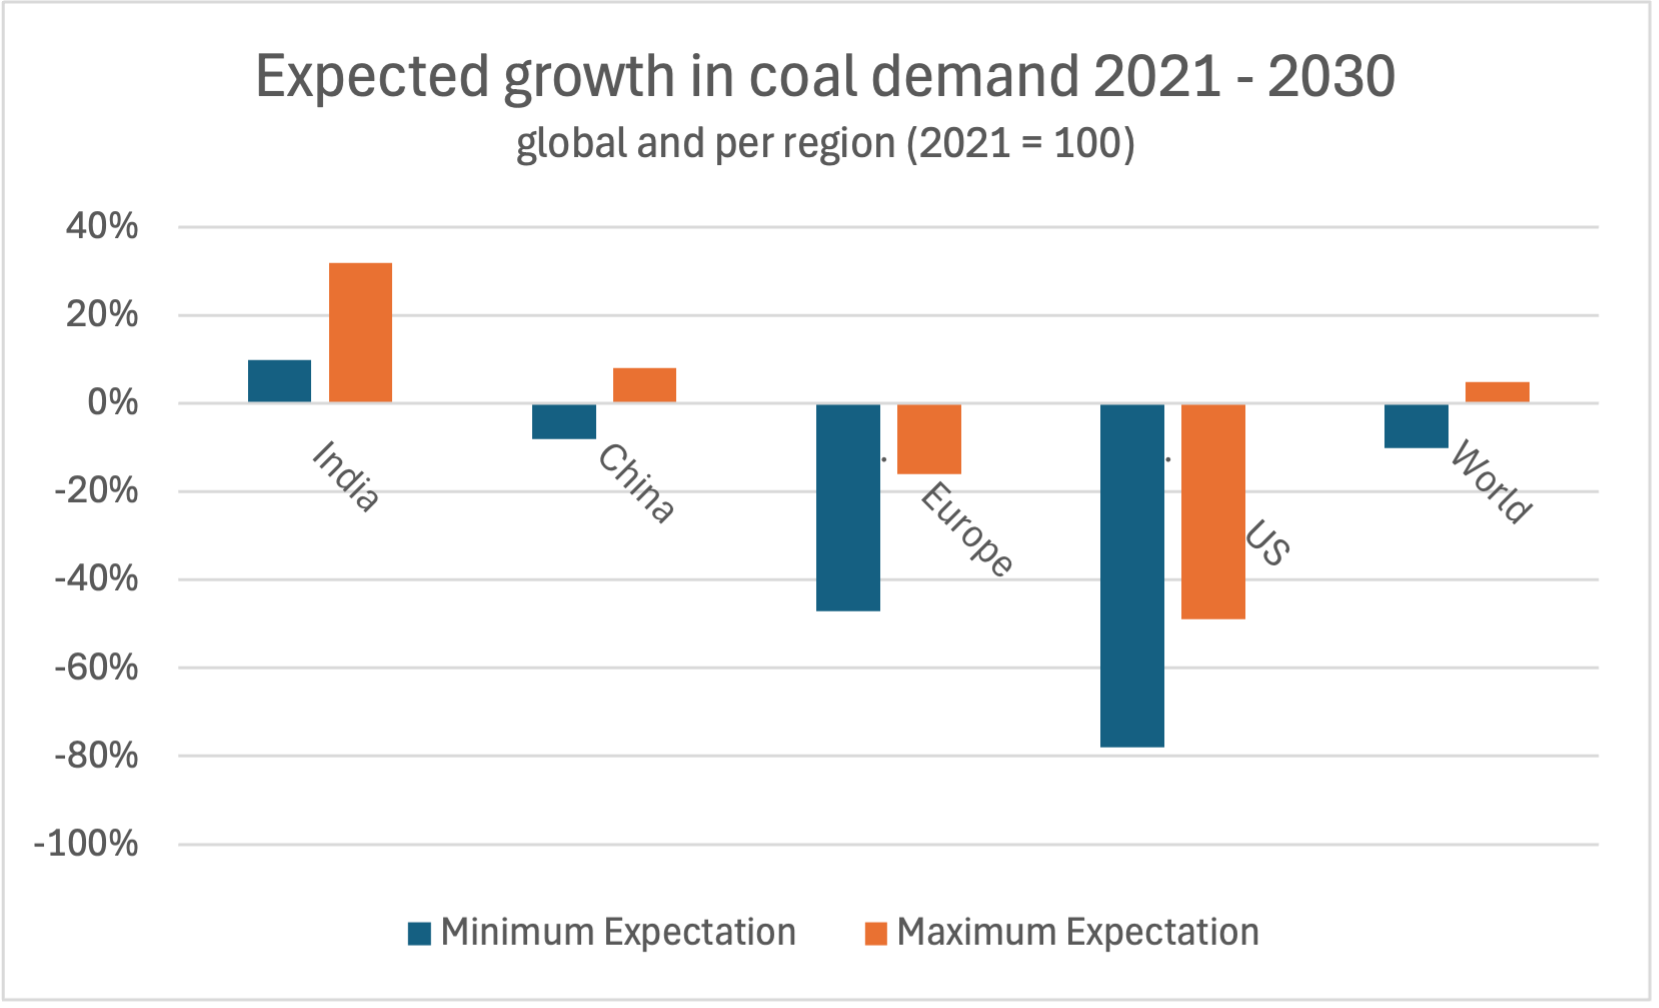
Source: RAF composed graph based on public data (UK Energy Institute Statistical Review of World Energy, IEA).
China and India are determined to exploit their “cheap” and heavily subsidized coal resources, fully aware of the climatic calamities they will suffer as a consequence and inflict on the rest of the world.
If China and India internalized the cost of these calamities (Proposition 2), these projects would be unviable. This focus on coal is particularly alarming because the combustion of coal is far dirtier than that of oil or gas.
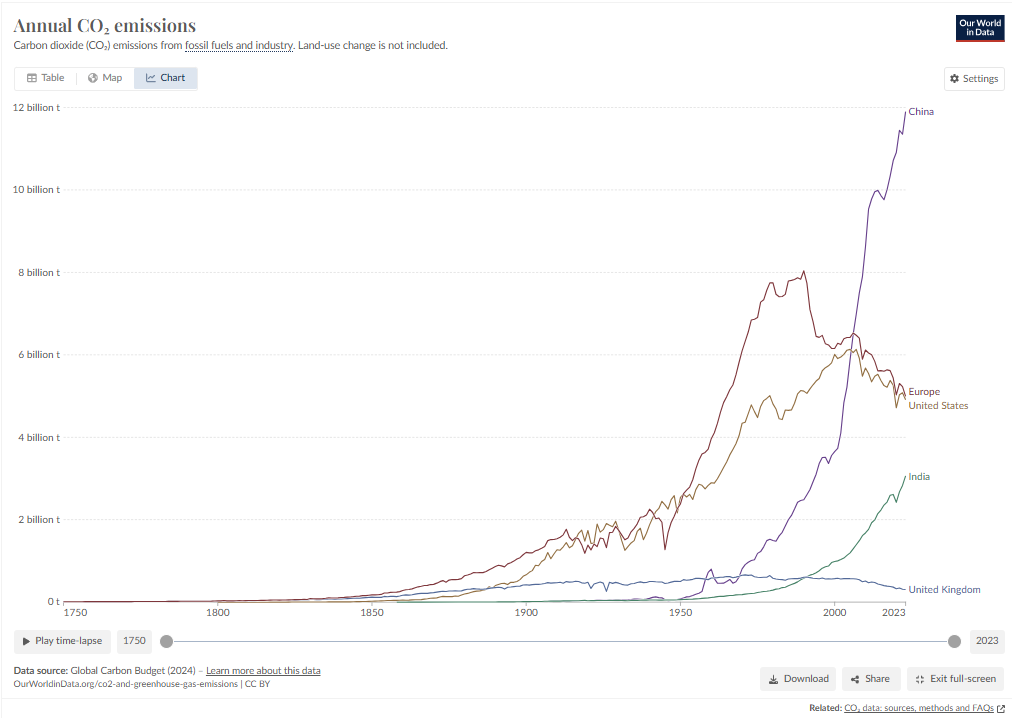
Source: Our World in Data; data: Global Carbon Budget (2024). CC BY 4.0. ourworldindata.org/co2-and-greenhouse-gas-emissions
China, heavily subsidizing its growing coal industry, has become the top polluter and the largest driver of global warming. India aims to become the second largest in this race to the bottom. This 2023 snapshot is expected to worsen considerably as even more new Chinese and Indian coal-fired capacities come online in the next five years.
For 2024 however, torrential rains have filled Chinese hydroelectric dam reservoirs, after years of drought. These will need to be cleared of backed-up floodwaters, if only to ensure public safety, producing abundant electricity. After that, coal will resume its growth as Chinese electricity usage seems to accelerate. In the past five years, it has hit 424 TWh annually — like adding the entire annual electricity consumption of Saudi Arabia to the grid, every 12 months.
Source: Our World in Data; data: Global Carbon Budget (2024). CC BY 4.0. ourworldindata.org/co2-and-greenhouse-gas-emissions
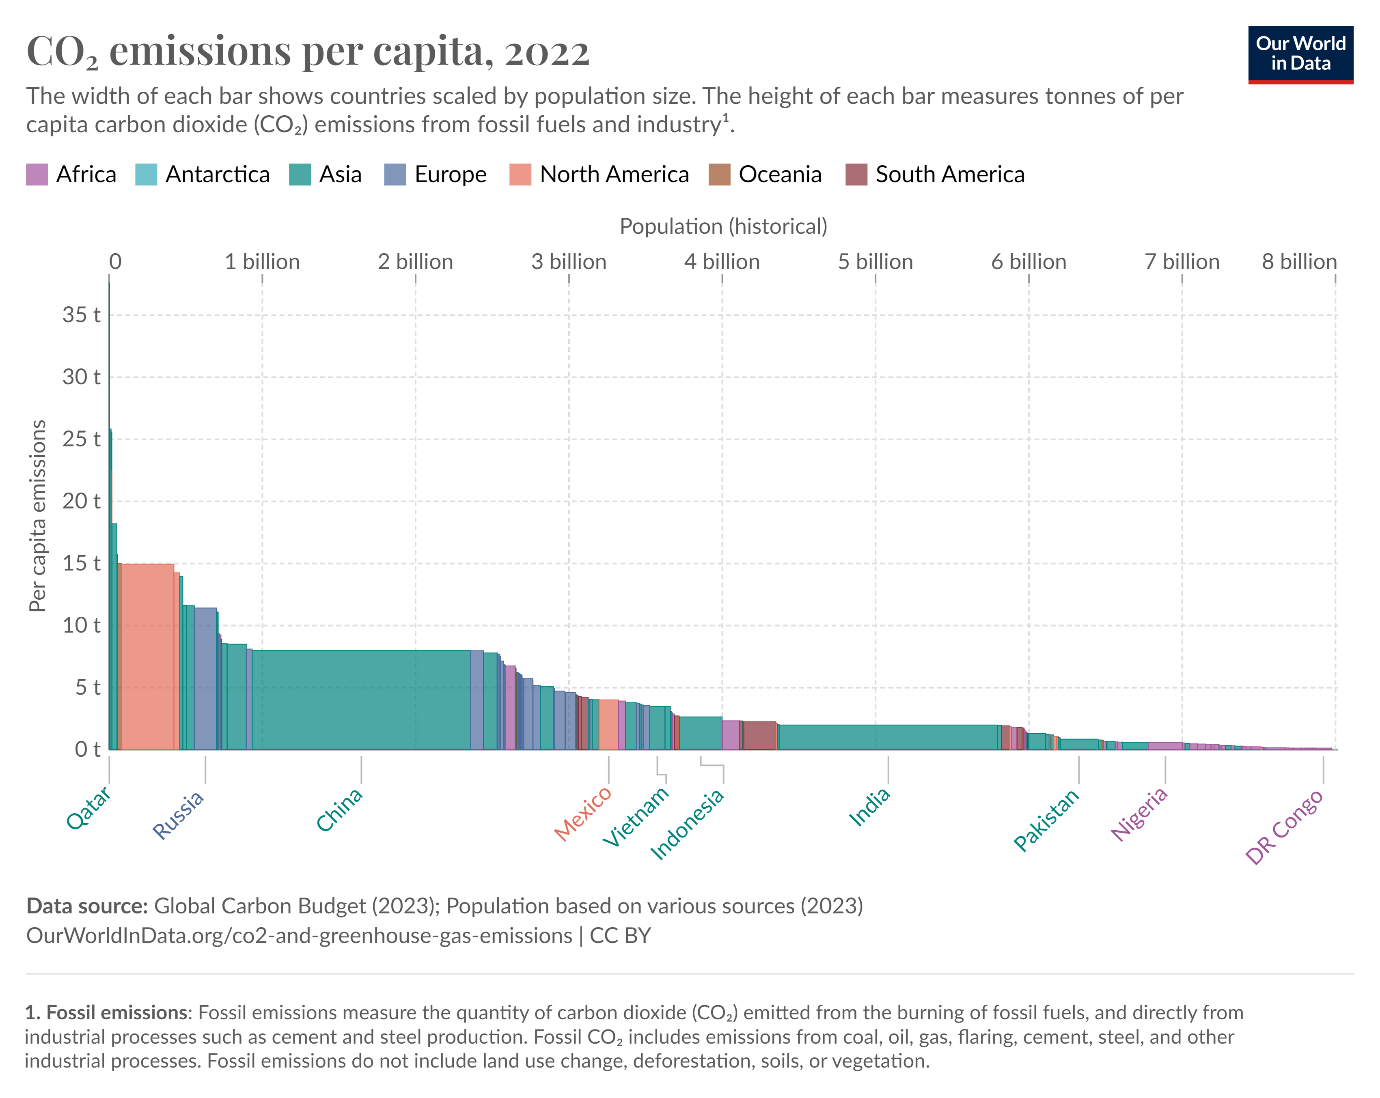
Source: Our World in Data; data: Global Carbon Budget (2024). CC BY 4.0. ourworldindata.org/co2-and-greenhouse-gas-emissions
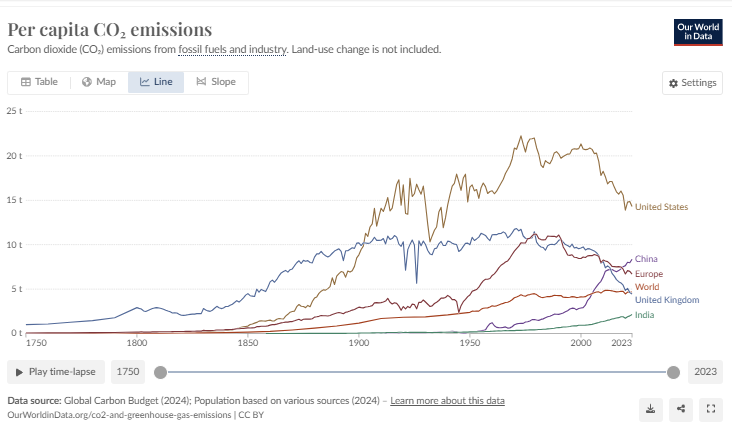
Even when analysing CO2 emissions per capita (or per GDP), see above graphs, the rise of China and India during the Age of the Great Acceleration (of global warming) is disastrous. The analysis also underscores the significant efforts required by the USA and Canada to reduce per capita CO2 emissions to at least the EU level. Biden’s Inflation Reduction Act in the USA, or what is left of it at the time of writing, favouring renewable energy, was a major positive step in the right direction. Conversely, Russia remains a significant concern.
During the combustion of fossil fuels, burning hydrogen to produce water vapour releases the most heat. Coal however is relatively poor in hydrogen relative to carbon, with a ratio of about 0.5 hydrogen per carbon, while natural gas (CH4) has a ratio of 4 hydrogen per carbon (oil sits in the middle). As a result, coal releases about twice as much CO2 per unit of energy produced than natural gas.
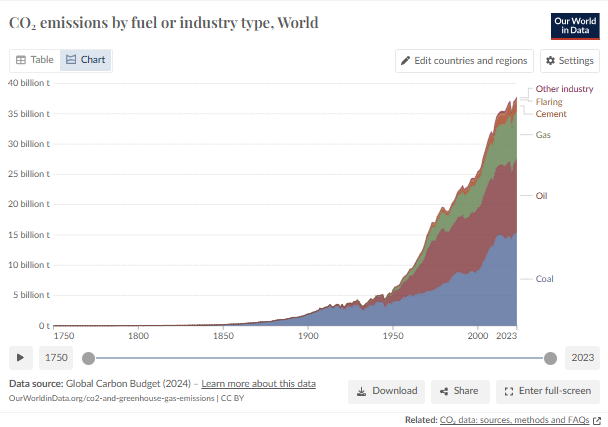
Source: Our World in Data; data: Global Carbon Budget (2024). CC BY 4.0. ourworldindata.org/co2-and-greenhouse-gas-emissions
Additionally, coal combustion releases sulphur dioxide, nitrous oxide, particulate matter, heavy metals, and soot (fly ash) into the atmosphere, and generates hazardous bottom ash. Some of these pollutants can be scrubbed out of the exhaust gases, but never completely, further reducing coal’s combustion efficiency. Burning coal for energy should be banned as its hazardous emissions are cooking the planet.
Today, there are plenty of cleaner, cheaper ways to generate power than coal (see Proposition 7, Renewables have the Lowest LCOE).
Finally, in the debate about allocating responsibility for global warming, a historical perspective is sobering.
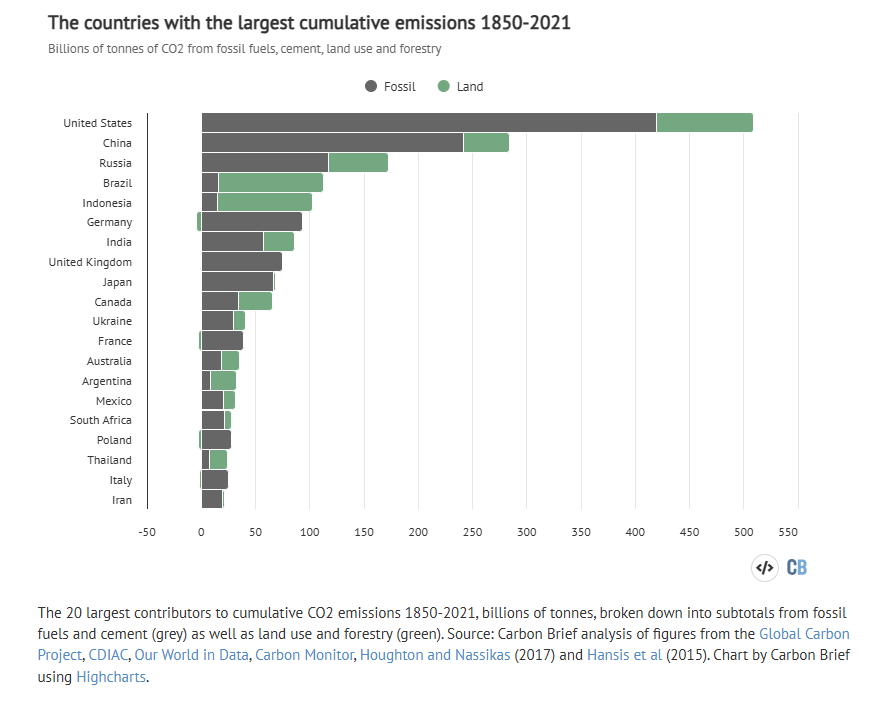
Source: Carbon Brief analysis; data: Global Carbon Project, CDIAC, Our World in Data. CC BY-NC-ND 4.0 (used by RAF, a Dutch ANBI non-profit, under non-commercial educational use). carbonbrief.org
Published by Our World in Data
Of the approximately 2,600 gigatons of cumulative anthropogenic CO2 emissions released since 1850 – excluding other greenhouse gases – the United States bears the largest share of historical responsibility. It is followed by the BRIICS countries (Brazil, Russia, India, Indonesia, China, and South Africa). China stands out for the massive emissions of its coal-fired power plants, Russia is unconcerned with GHG emissions, Brazil and Indonesia leap out for their recent large-scale deforestation, which has contributed significantly to anthropogenic CO2 emissions through land use, land-use change, and forestry (LULUCF). By contrast, some countries – mostly within the European Union – have implemented modest reforestation programmes. Many analysts tend to overlook or underestimate the impact of LULUCF-related emissions. Also check Tropical Deforestation and Biofuels expansion in Proposition 5 and Soot in Chapter 7. (Regarding the more than 200 years lifetime of CO2 in the atmosphere, implicit in the claim that emissions from the 1850’s still count, check out Chapter 3, Greenhouse gases absorb infrared radiation, but they re-emit it).
Proposition 7: Renewables have by far the lowest Levelized Cost of Energy (LCOE). Jevons Paradox. Rare-earth elements.
Source: Tuluhong, Chang, Xie, Xu & Song (2024), ‘Current Status of Green Hydrogen Production Technology: A Review’, School of Electrical Engineering, Xinjiang University. Sustainability 2024. CC BY 4.0. doi.org/10.3390/su16031148
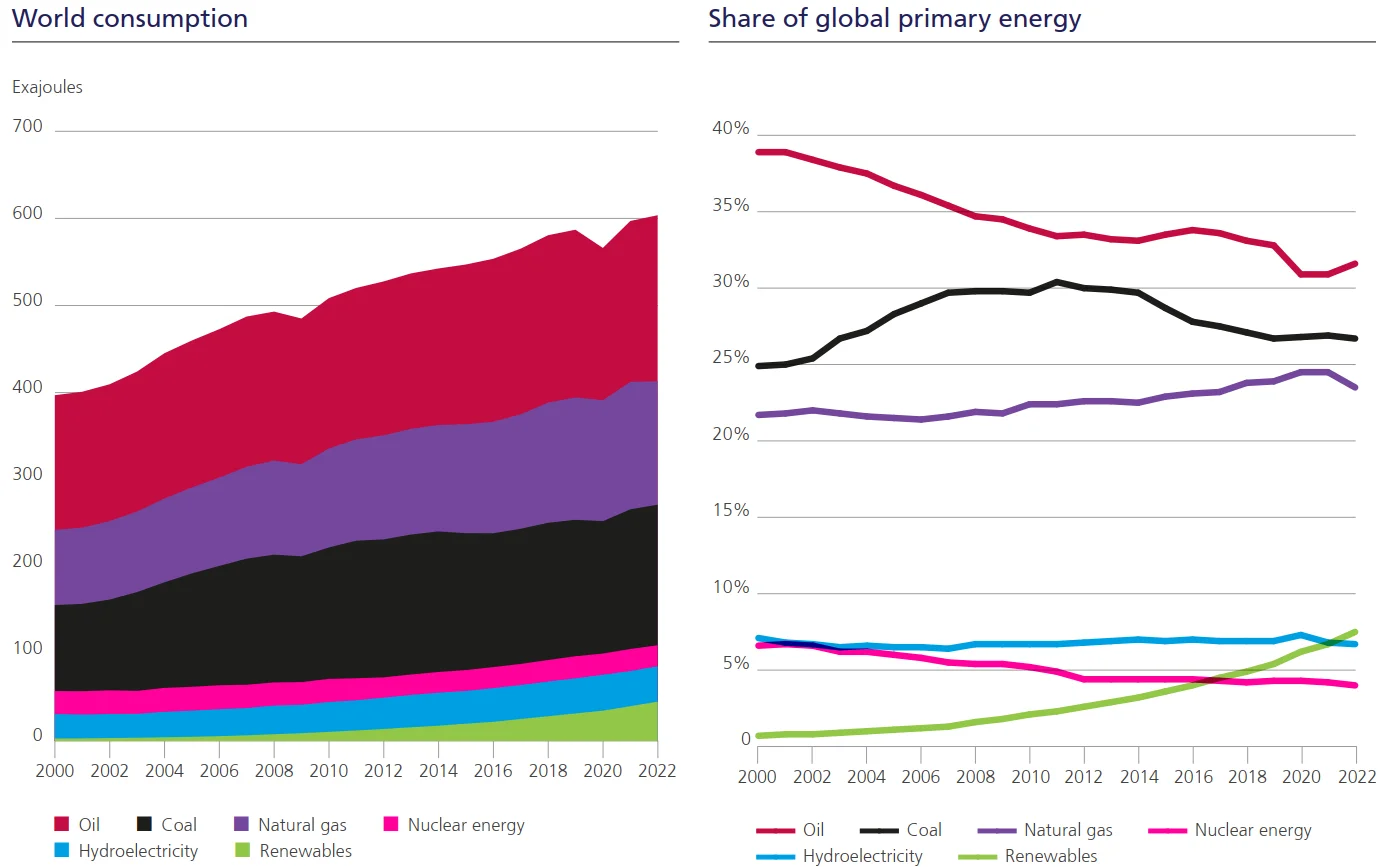
Could a switch to renewables save the planet? Since 2000, renewables have significantly increased their share of primary energy. Combined with hydropower, they now account for 12-13% of total primary energy consumption, offsetting the decline in nuclear power’s market share (primary energy is the raw energy source extracted directly from nature, such as fossil fuels, renewables, or nuclear materials, before any conversion or transformation).
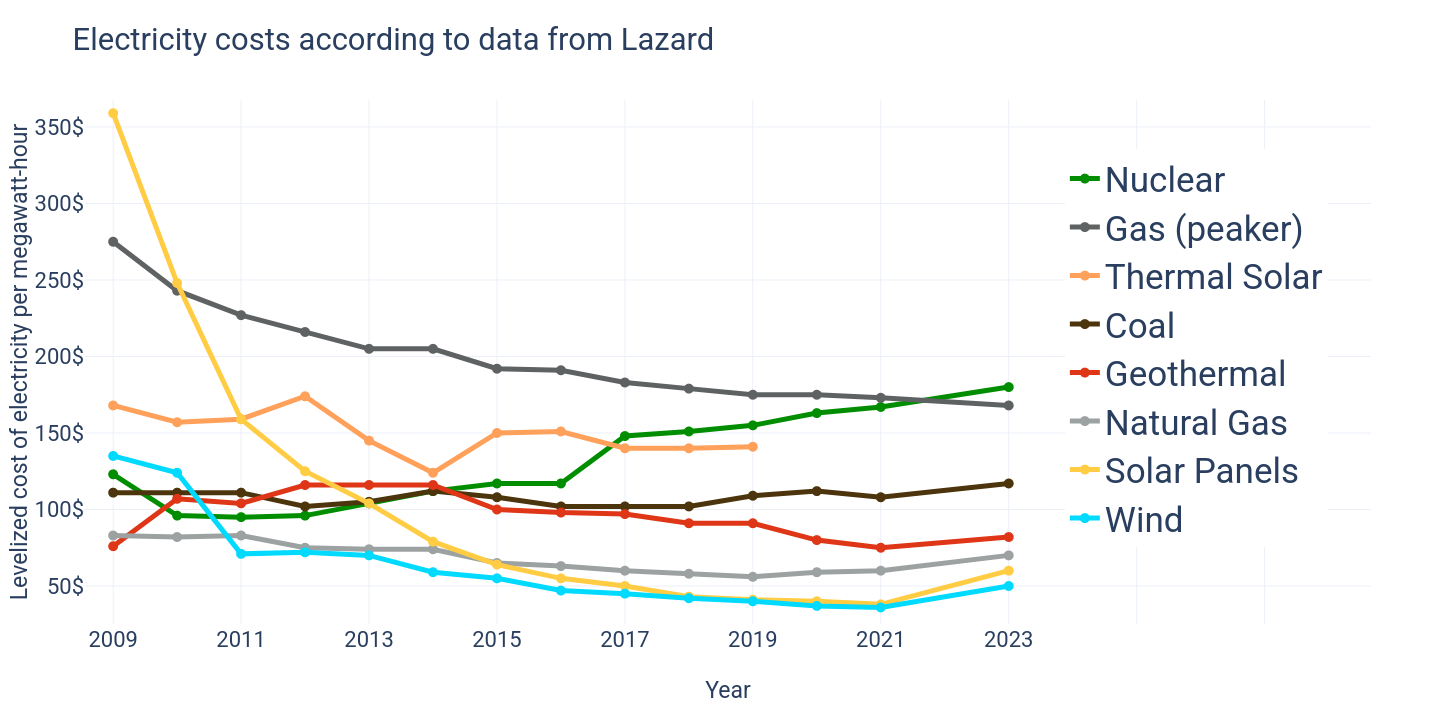
Source: Wikimedia Commons; data: Lazard’s Levelized Cost of Energy Analysis. CC BY-SA. commons.wikimedia.org
Even better, by 2015, the Levelized Cost of Electricity (LCOE) for solar and wind power had already fallen below that of even the cheapest fossil fuel, natural gas (CH4). This metric, which calculates the average cost per megawatt-hour of electricity generated over the lifetime of the asset, does not include any subsidies nor does it consider the environmental costs of greenhouse gas (GHG) emissions. If the latter were considered (scope 3 and carbon tax, see Propositions I, II, III), the LCOE of fossil fuels, including natural gas, would increase dramatically.
Given this substantial cost advantage, renewables are increasingly poised to challenge the dominance of fossil fuels. Falling prices for solar and wind energy, along with improvements in storage and grid management, have made renewables both cleaner and more economically viable than any fossil fuel alternative!!! It is worth repeating that sentence.
In 2022, Robert Idel of Rice University argued that the Levelized Full System Cost of Electricity (LFSCOE) was more relevant, which accounts for all the (battery) storage needed to keep a 100% renewables-powered grid stable (https://doi.org/10.1016/j.energy.2022.124905).
Idel concluded that a 100% renewables grid would be more costly to run than a non-renewables one (based on fossil fuels, biomass and nuclear), even if battery cost would fall by 90%. And always assuming that GHG emissions have no environmental cost… Idel admitted that the LFSCOE of a 95% renewables-power grid would be reduced by 50% because it avoided the massive over-capacity in wind, solar and battery needed to achieve 100% cover. Since then, battery costs have fallen by 40%, thanks in part to LiFePO4 chemistry—and that’s before ultra-cheap sodium-ion batteries, ideal for grid storage, hit the market. These are projected to cost just $40/kWh, far below lithium-ion’s $130–160/kWh. Grid-scale energy storage is on the brink of a revolution!
Besides, excess wind, solar and battery capacity can be put to valuable use to produce hydrogen and ammonia or to power desalinization plants.
In response, fossil fuel companies are doubling down on fossil fuel investments in the hope of locking-in consumers into long-term supply contracts. However, consumers can rightfully reject these contracts, which always omit pollution costs, in favour of renewables that are better for both their finances and the environment.
Concerns about resource limitations in renewable energy technologies (e.g., rare earth elements, copper, steel, and sand) are valid but shouldn’t overshadow innovation and alternative solutions.
Firstly, in a renewables-powered world, primary energy consumption is expected to collapse due to the absence of heat losses of about 70% involved in burning fossil fuels for energy (see Proposition 8). Further decreases in primary energy consumption will occur due to energy savings, increased efficiency, localized production and recycling. Judicious conservation policies would avoid the Jevons paradox, which observes that when a resource like energy becomes cheaper or more abundant, its consumption increases.
Stop press: the rise and rise of electricity gobbling AI data centres unfortunately seems to vindicate the Jevons paradox. However, China’s DeepSeek seems to point to a less electricity-consuming path forward for AI. Regarding Bitcoin, its Proof-of-Work mechanism still requires vast computational energy, and therefore, electric energy. Its network consumes 127 TWhr annually, comparable to the electricity consumption of The Netherlands. And to what purpose, a naïve reader may ask.
Secondly, rapid advancements in materials science are providing more abundant, cost-effective alternatives, such as aluminium for electrical wiring (instead of coper), sodium for batteries (instead of lithium), and substitutes for sand in concrete. Research is also focused on replacing critical materials like rare earth elements in wind turbines and EV motors, reducing supply risks (see the note: rare-earth elements are not rare). Innovations in 3D printing are increasing efficiency and cutting waste, while advancements in recycling for renewable assets like batteries, wind turbines, wind blades, and solar panels can help reduce dependence on scarce resources.
Despite their name, rare-earth elements aren’t actually all that rare in terms of abundance. The term “rare-earth” refers more to their difficulty of extraction and the fact that they are often found in low concentrations. There are 17 elements in this group, including the 3 in highest demand: neodymium (Nd 33%), cerium (Ce 31%) and lanthanum (La 20%). While some of these elements are relatively abundant in the Earth’s crust, they are usually dispersed and not found in large, easily accessible concentrations. This makes mining and processing them complex and expensive. China has accepted the huge environmental cost of extracting rare earths and now controls 70-80% of global output.
Despite their name, rare-earth elements aren’t actually all that rare in terms of abundance. The term “rare-earth” refers more to their difficulty of extraction and the fact that they are often found in low concentrations. There are 17 elements in this group, including the 3 in highest demand: neodymium (Nd 33%), cerium (Ce 31%) and lanthanum (La 20%). While some of these elements are relatively abundant in the Earth’s crust, they are usually dispersed and not found in large, easily accessible concentrations. This makes mining and processing them complex and expensive. China has accepted the huge environmental cost of extracting rare earths and now controls 70-80% of global output.
Proposition 8: Renewables and job creation. “Reconstructible” Energy. Jobs/GWh.
Renewable energy creates more local jobs compared to the fossil fuels industry. These jobs are generally higher quality, less physically demanding, less dirty, and more stable due to the ongoing maintenance needs of renewable assets and their eventual replacement. In fact, a better name for renewable energy should be “reconstructible” energy, which promotes good paying, long duration, local jobs. In contrast, jobs in the fossil fuels industry are concentrated on locations of extraction and refining, and fluctuate with energy commodity prices, as witnessed by the countless booms and busts in that sector.
| Measure / Metric | Renewable Energy | Fossil Fuels | Notes / Source |
|---|---|---|---|
| Jobs per $1 million invested | ~7.49 jobs | ~2.65 jobs | Renewables create ~3× more jobs per dollar invested than fossil fuel industries. (publications.iadb.org) |
| Jobs per $1 million (other studies) | ~17 jobs (varies) | ~5 jobs | Another analysis also finds renewables generally create more jobs per investment. (pugetsound.edu) |
| Relative jobs from equivalent spending | Solar ~1.5× jobs; Geothermal ~1.7× | Baseline fossil fuel | Solar and other clean investments generate more jobs for the same amount spent. (World Economic Forum) |
| Global total energy jobs (2023) | ~16.2 million jobs | ~(fossil jobs lower) | Clean energy employment continues to grow rapidly globally. (United Nations) |
| Jobs per unit of electricity (GWh) | ~0.65 jobs/GWh on average | ~0.15 jobs/GWh | Renewable energy tends to be more labour-intensive per unit generated. (OUP Academic) |
For the USA specifically (where, until 2024, more data were available):
| Metric | Renewable / Clean Energy (U.S.) | Fossil Fuels (U.S.) | Notes / Source |
|---|---|---|---|
| Total clean energy jobs (2024) | ~3.56 million | (Oil, gas, coal electric generation) ~0.2 million* | Clean energy jobs include renewables, efficiency, EVs, storage; fossil electric generation workforce much smaller. (NRDC) |
| Energy efficiency jobs | ~2.38 million | — | These are part of clean energy totals. (E2 Environmental Solutions) |
| Clean energy employment share of U.S. energy jobs | ~42 % of all energy jobs | Remaining share (~58 %) includes fossil fuels & other energy tech | Clean energy now a major segment of energy jobs. (E2 Environmental Solutions) |
| Job growth rate (2023) | +4.2 % overall clean energy job growth | +1.8 % fuels sector growth | Clean energy jobs grew faster in 2023 than fossil fuel jobs. (The Department of Energy’s Energy.gov) |
| Clean energy vs fossil growth since ~2021 | Clean electricity jobs +11 % | Fossil electricity jobs +7 % | Job growth in renewables outpaced traditional generation. (World Resources Institute) |
| Job creation per $1 million invested (clean energy) | ~16.7 jobs | ~5.3 jobs | Clean energy creates ~3× more jobs per investment than fossil fuels (analysis context). (Center for American Progress) |
Estimates vary by source and methodology; figures illustrate general trends, not exact job-for-job comparisons.
A RAF ChatGPT search reveals convincing numbers in favour of renewable energy.
It’s hard to argue with the huge number of well-paid jobs renewable energy is creating!
Proposition 9: Fossil fuel’s best kept dirty secret: 70%(!!!) inefficiency.
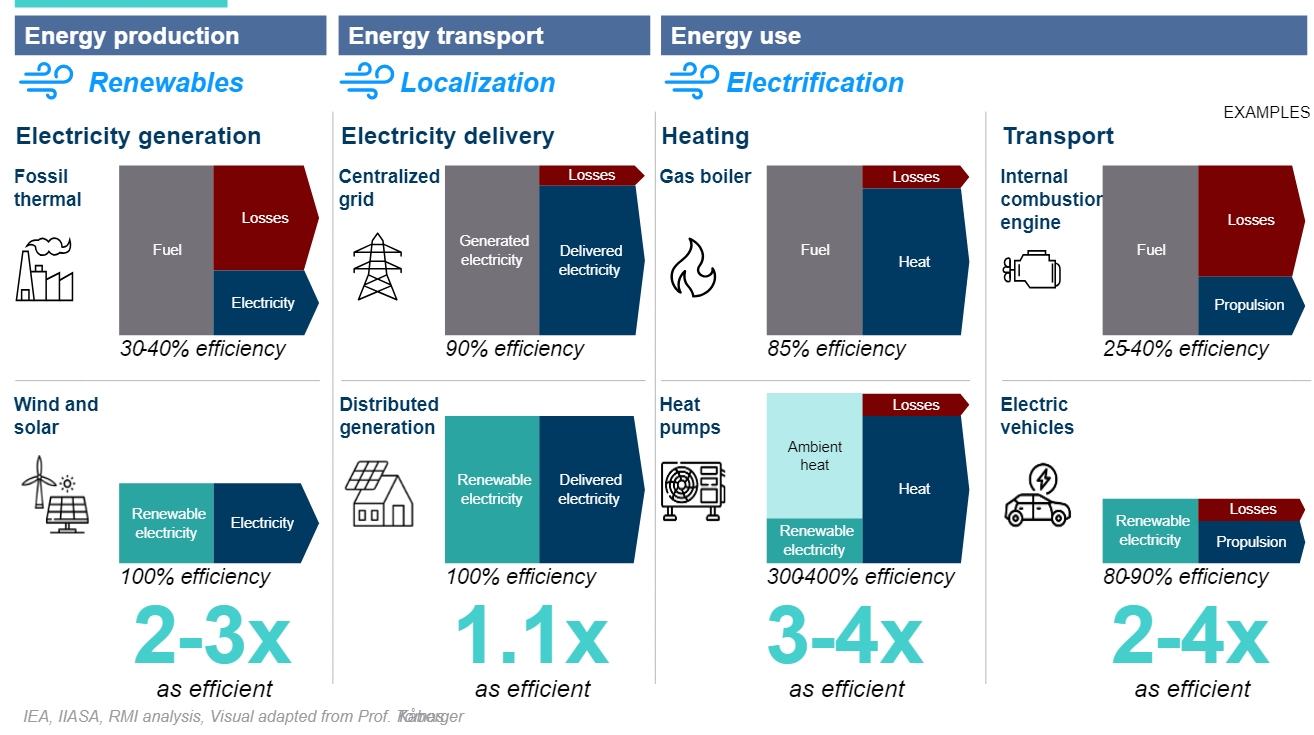
Source: IEA, IIASA, RMI analysis; visual adapted from Prof. Kübler. CC BY 4.0 (IEA); IIASA open data; RMI educational use.
Fossil fuels hide many dirty secrets, of which the best kept one is probably inefficiency. They lose 60-70% (!!!) of their primary energy as heat(!) during combustion, be it in a power plant or a car engine. That wasted heat – in fact hot air – is therefore the main source of fossil fuel GHG emissions. Isn’t that just shocking? It is worth repeating this paragraph aloud.
Even the efficiency of a gas boiler (85%), that only needs to provide residential heat, pales in comparison to that of a heat pump (300-400% efficiency). In a renewable-powered world, the 500 exajoules (140.000 TWh) fossil fuel primary energy consumption in 2022 (see Proposition 6.) could be replaced with less than… 250 exajoules (70.000 TWh) renewables + hydro because the latter have no heat losses! And don’t emit greenhouse gases nor cause other severe environmental damage! Distributed electricity generation, such as solar panels with batteries, could save an additional 10% in transmission losses. And most consumers – residential or industrial – in large urban agglomerations would easily save another 10-25% on their energy consumption without even noticing it, if fossil fuels were priced including the cost of their GHG emissions (see Propositions 1 and 2). This is extremely bad news for the fossil fuel industry. And this is why its very survival depends on the success of its massive lobbies, even in the Global South, where renewables should be an obvious choice.
In February 2025, the UK released its 7th Carbon Budget, predicting that reaching net zero by 2050 will cost 0.9% of GDP annually in – mostly front-loaded – investments. By 2040, the savings from reduced operational costs are expected to outweigh transition capital expenditures (away from fossil fuels). The total net effect of such transition would cost 0.2% of GDP annually. In 2025, 1,859 TWh of UK primary energy delivered only 900 TWh of useful energy, with massive losses from fossil fuel heat and transmission inefficiencies. By 2050, thanks to dramatically improved efficiency, just 1,249 TWh of primary energy will generate 1,000 TWh of useful energy—a 33% drop in primary energy use compared with 2025, while useful energy rises by 10%. The authors clearly believe in the transformative nature of the energy transition combined with effective policies to counter the Jevons paradox discussed in Proposition 7.
Proposition 10: Greenhouse gas emissions by sector. Transition is easier done than said.

Source: Our World in Data; data: Climate Watch (2023). CC BY 4.0. ourworldindata.org/co2-and-greenhouse-gas-emissions
The vision of a world powered entirely by renewable energy is not just a distant dream but an achievable reality, given the technologies available today. Consider the sector analysis of GHG emissions .
If we transition to renewable-generated electricity, the mountain of greenhouse gas (GHG) emissions from electricity and heat production would disappear, as if by magic (see above Proposition 9: Fossil Fuel’s dirty secret). And so would GHG “fugitive” emissions—those that mostly escape control during extraction and processing of fossil fuels (see Chapter 3, Global Warming Potential/ Note on methane).
In this renewable-powered world, transportation would be revolutionized through widespread replacement of the Internal Combustion Engine – with its catastrophic heat loss – by the electric engine in electrical vehicles (EVs). Smart, distributed mobility solutions, would further lead to a dramatic decrease in GHG emissions from the sector.
Construction, another significant contributor to GHG emissions (due to the massive release of CO2 during the production of concrete), would shift to alternative materials that are already available on the market and are largely GHG-free.
The agriculture sector, notorious for its GHG emissions, deforestation and ground water depletion through factory farming, could also undergo a transformation. By phasing out factory farming and embracing plant-based and cellular meat alternatives, we could significantly diminish agriculture’s catastrophic impact on the climate (and on water resources and biodiversity). A mere 50% switch – not 100% – to alternative proteins (plant-based or cellular), which can easily be achieved in the West and China, would reduce yearly agricultural GHG emissions by a whopping 5 to 6.3 CO2e Gigatons (1 Gigaton = 1 billion tons), halt and reverse deforestation, mitigate open water eutrophication by reducing fertilizer use and reduce water use by at least 10%. Internalizing the cost of pollution would send factory farming meat and dairy prices skyrocketing, collapsing demand. Phasing out factory farming to the benefit of alternative proteins is probably our best and most immediate chance to reverse the trajectory of global warming! (for a devastating account of the environmental impact of factory farming and biofuels, see Proposition 5, HIPPO).
Even without considering the cost of the environmental catastrophe inflicted by the ultra-polluting factory farming industry, in 2023 high quality alternative proteins became cheaper to produce than chicken meat – the cheapest meat – on a protein/kg basis. These high-quality alternative proteins could immediately replace meat in all flavoured applications (shawarma, kebab, sausage, Bolognese sauce, pizza dressing, hamburger, chicken nugget, most cold cuts and most chicken and pork recipes in Chinese cuisine etc…), reducing meat consumption by 50% at no organoleptic cost whatsoever, becoming even cheaper and tastier as demand takes off and adding health benefits to the package.
Instead, the meat and dairy industries are recipients of perverse, distorted subsidies. In 2014-2020, the USA and the EU provided usd 35 billion subsidies to the mighty factory farming industry, mainly to improve production, and only usd 35 mio (a thousand times less) towards plant-based alternatives. By market share, the 2% plant-based proteins market received 0,1% of the subsidies (World Bank, Institute for Applied Sciences, Deloitte, Boston Consultants, Stanford and the University of California, Berkeley etc…). As to growing crops for biofuels, with the possible exception of sugarcane ethanol, this is a heavily subsidized activity with severe environmental impacts, now largely made obsolete by the advent of cheap solar and wind energy (see Proposition 5, Biofuels Expansion).
Fugitive emissions would be reduced to next to nil thanks to the phase-out of fossil fuels.
Industry is a hard nut to crack. Eventually renewable electricity, and green ammonia and hydrogen might offer solutions in most industrial applications.
Hydrogen comes in fashionable colours: grey is made from natural gas and emits massive amounts of CO2; blue uses the same process with carbon capture attached – cleaner in theory, however no economically viable carbon capture exists today; and green splits water using renewable electricity, producing hydrogen with minimal direct emissions. For now, most hydrogen is still grey – proof that the colour of the label does not always match the climate reality.
Buildings, often major energy consumers, would be insulated effectively and equipped with heat pumps for efficient heating and cooling, further reducing their carbon footprint.
Aviation and shipping, traditionally challenging sectors to decarbonize, could transition to battery power combined? with green ammonia and hydrogen. These fuels would provide the energy needed for long-distance travel without the associated GHG and soot emissions (or contrails of today’s jet engines). This is why Sustainable Aviation Fuel (SAF) is only an intermediary step to decarbonization, as it still emits soot which acts as condensation nucleus for cirrus-like contrails.
| Category | Main Commodities | Approx. Annual Volume (million tonnes) | Notes / Major Exporters |
|---|---|---|---|
| Fossil fuels | Crude oil & petroleum products, Coal, LNG | 2,500–3,000 (oil), 1,000 (coal), 400 (LNG) | Oil: Saudi Arabia, Russia, US; Coal: Australia, Indonesia; LNG: Qatar, Australia, US |
| Ores & minerals | Iron ore, Bauxite & alumina | 1,500–2,000 (iron ore), 300 (bauxite/alumina) | Iron ore: Australia, Brazil; Bauxite: Australia, Guinea |
| Agriculture | Grain & cereals | 400–500 | Wheat, corn, soybeans; US, Brazil, Ukraine |
| Manufactured goods | Containerized goods | 900 | Electronics, machinery, clothing; shipped globally |
| Chemicals | Fertilizers & industrial chemicals | 200–300 | Nitrogen, phosphate, potash; Russia, Morocco, Canada |
Marine Shipping Volumes in mio MT, source: RAF ChatGPT search
At present, marine shipping generates 3% of global greenhouse gas emissions, more than aviation. In a renewable-powered world, the long-distance maritime transport of fossil fuels would largely disappear, and ships would instead operate on clean(er) energy (see also Chapter 5, Soot). At the same time, a significant reduction in factory farming would greatly diminish the need to ship grain and cereals across the globe (mainly as factory farming feed) and… fertilizers to the main growing regions for animal feed and biofuels.
| Rank/Region | Approx. 2024 Fertilizer Imports (USD) | Share/Notes |
|---|---|---|
| Brazil | ~$15.0 billion | World’s largest single importer (~15 % of total) |
| United States | ~$9.4 billion | Major importer with strong agricultural demand |
| India | ~$7.8 billion | Large importer due to high domestic crop nutrient demand |
| European Union | ~$6.9 billion | EU as a bloc is a large importer |
| China | ~$4.6 billion | Significant imports despite large domestic production |
The Fertilizers Trade, Source: RAF ChatGPT search
The dip in greenhouse gas (GHG) emissions in 2020 was largely due to the significant reduction in economic activity caused by the COVID-19 pandemic. Lockdowns, reduced travel, and lower industrial output temporarily slowed the pace of emissions. However, this decline was short-lived, and by 2021, GHG emissions began to rise rapidly again as economies reopened and activity resumed. This revival highlights the ongoing challenge of achieving sustained reductions in GHG emissions without efficiency drives and structural changes to energy systems and industrial practices.
In essence, the technology and know-how required to shift from a fossil fuel-based economy to one powered by renewables already exist and are more cost-effective than their fossil fuel counterparts, even without considering the environmental cost of fossil fuel generated GHG-emissions. The same applies in agriculture for a shift from factory farming to alternative proteins and from most biofuels to wind and solar energy. The principal obstacle to these transformations is not technological feasibility, but collective resolve – the political will and societal determination to deploy existing solutions at scale. The choice before us is stark: act decisively to build a sustainable future, or cling to complacency and short-term interests, and face climate chaos.
Proposition 11: Peak oil, gas and coal. Transitioning to renewables is 4 to 12 times cheaper than adapting to climate change. Our addiction to fossil fuels is killing us. The sooner we act, the cheaper.
We seem unable to shake off our fossil fuels addiction.

Source: RAF composed graph based on public data (IEA Oil Market Report, OPEC World Oil Outlook, BP Energy Outlook).
Source: RAF composed graph based on public data (IEA Gas Market Report, OPEC, BP Energy Outlook).
Source: RAF composed graph based on public data (IEA Coal Report, OPEC, BP, UK Energy Institute).
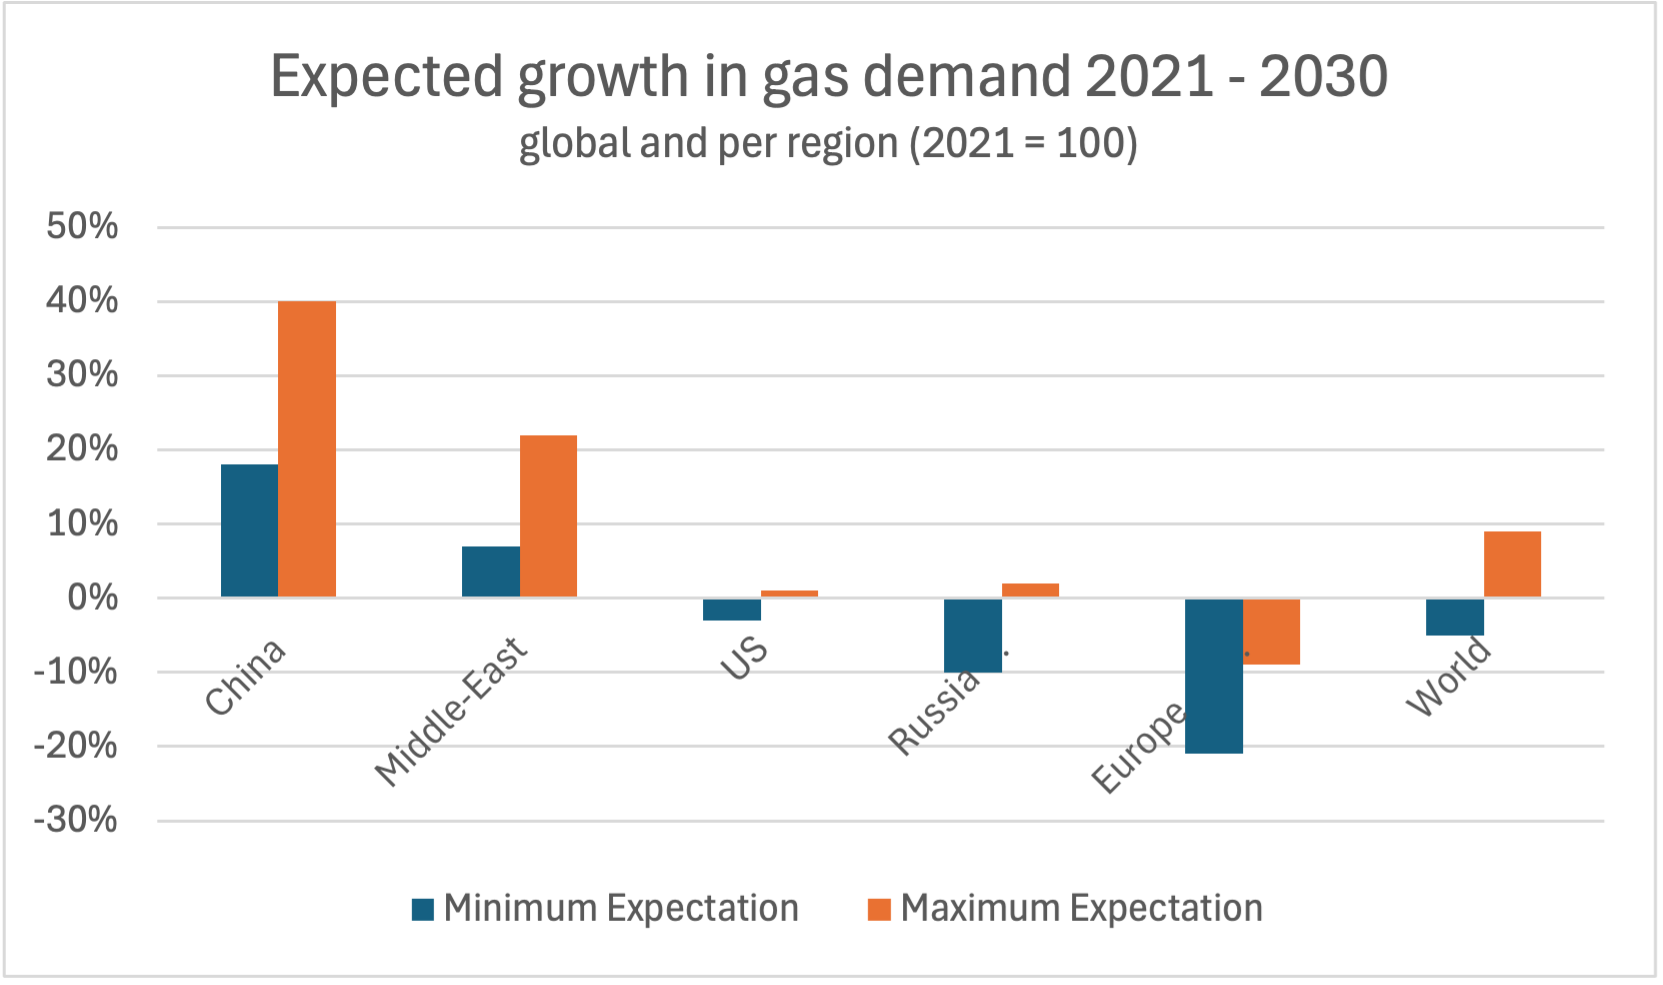
According to a 2023 forecast by the Economist Intelligence Unit (EIU), we are yet to reach peak gas and oil production, whilst coal is resurging in China and India.
What’s in a trillion? PIK calculates that the cost of adaptation will reach $19-59 trillion per year by 2050, or $39 trillion on average. That is $9 trillion more than today’s U.S. GDP. Per year.
In 2024, investment in oil and gas exploration will almost double to us $ 600 billion for the first time in a decade. As analysed previously, none of these investments makes any economic sense when considering the environmental cost of GHG-emissions. These investments exclusively serve the interests of a clutch of fossil fuels industry executives and their shareholders to the detriment of all of us (the claim that decarbonizing our economies causes job losses is thoroughly debunked in Proposition 8, “Reconstructible” Energy. Jobs/GWh: the opposite is true!).
Unfortunately, on current trend, record and near record-high annual GHG emissions are here to stay.
And yet, a rapid switch to renewables is still possible as South Australia shows. By 2030, South Australia, home to 2 million people, could reach 100% renewable electricity generation and reduce GHG-emissions by 50% (compared to 2005 levels).
Switching to renewables would put money in all our pockets except those of the fossil fuel industries’ executives and shareholders and it would save our planet for our children and grandchildren.

Source: RAF composed graph based on IEA World Energy Investment data. CC BY 4.0 (IEA). iea.org
According to the International Energy Agency (IEA), meeting the net-zero target by 2050 will require approximately $5 trillion in annual global energy sector investments by 2030, up from around $2 trillion per year today. The International Renewable Energy Agency (IRENA) estimates that transitioning to a renewable energy system could necessitate an investment of about $115 trillion by 2050. Investing a total of $110-130 trillion in renewables over 30 years should be compared with the projected $ 475 – 1,475 trillion usd cost of “adapting” to global warming by 2050, or $39 trillion per year on average, excluding (!) loss of life and biodiversity, the cost of which is hard to quantify (see Proposition 4: the calamitous cost of inaction). $5 trillion versus $39 trillion on average. The benefits of a rapid switch to renewables remain staggering, whatever metrics used to measure them.
For the time being however, due to insufficient progress on reducing GHG emissions and removing GHGs from the atmosphere, a global win-win Climate Repair Deal that makes overwhelming economic sense seems more distant than ever. It may require many more climate calamities of global magnitude to prompt negotiators to act. By then, humanity could have breached multiple climate tipping points, pushing the Earth system past critical thresholds and triggering runaway warming beyond our capacity to contain – unleashing profound and irreversible climate chaos.
Fortunately, refreezing the Arctic might buy time, temporarily reverse global warming, and keep these tipping points at bay, at least for a while. Refreezing can start now. Check out the RAF site: https://refreezethearcticfoundation.com/the-solution/